Drilling Through to Details
The drill-through operation displays detailed transaction information for a given aggregated value.
To work with source data
- Using the table created in Sorting the Display, click the number $87,218.28 next to Store 13.
The drill-through table appears in a new page.
This is the default behavior. You can also display the drill-through table in the same page as the navigation table.
The drill-through table shows the underlying data in the database that is used to generate the summarized information in the navigation table. This is useful for validation of results. Drill-through data can also reveal interesting trends or anomalies. For example, you might identify a particular demographic that tends to make larger purchases.
As shown in the following figure, Carbonated Beverages are among the items making up the Store Sales.
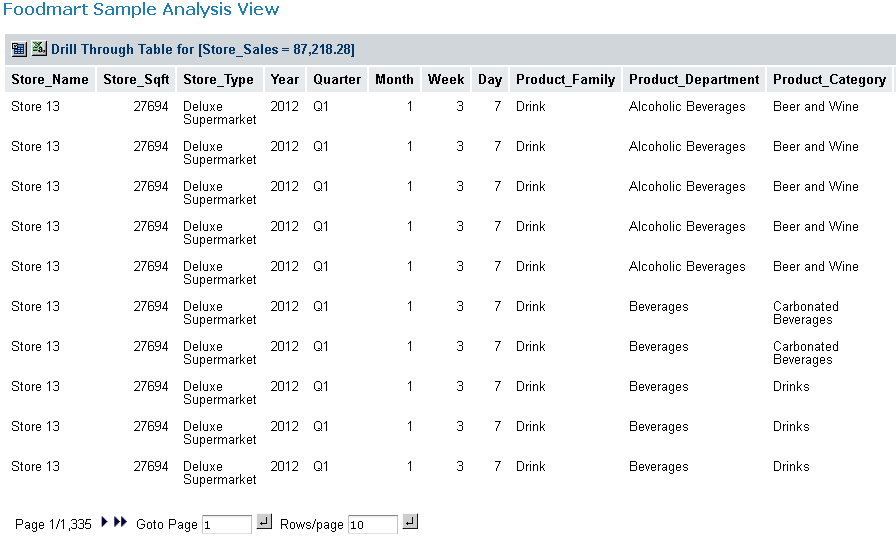
Figure 1 Drill-through Table Showing High-value Items
Note that you can export the current set of source data to an Excel spreadsheet by clicking at the top of the drill-through table. You can change the columns that are displayed and their sort order by clicking  . Navigate through the paged data and control the number of rows per page using the controls at the bottom of the drill-through table.