Displaying Charts
Charts can provide more dramatic visual impact. Create a simple view to display as a chart.
To view a chart:
1. From the Repository, open the Foodmart Sample Analysis View.
2. Click  .
.
3. Click the Move to Rows icon next to the Store filter to create a row, then click Store.
4. Expand All Stores in then USA, and select CA, OR, and WA. Click OK.
5. Click the filter icon  next to Promotion Media and Production in the Rows section to remove them from the row.
6. Click OK.
7. Click Collapse All  .
.
8. Click Show Chart  .
.
A default chart output appears.
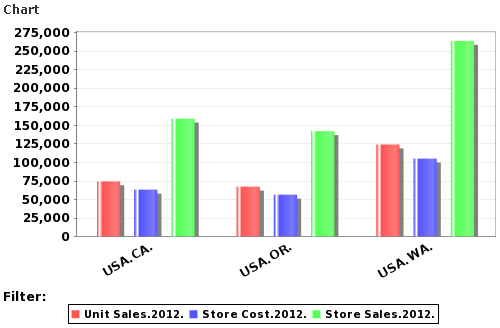
Default chart for Product Sales Across Store Locations