Admin Console
The Admin Console is a new page for JasperReports Server that allows system admins (superuser) and organization admins (jasperadmin) with detailed views of Schedules, Alerts, and Diagnostic data.
Users, other than administrators, do not have access to the Admin Console page and can view the Schedules, Alerts and Diagnostics details within the View>Schedules and Alerts page. For more information, see the JasperReports Server User Guide.
This chapter contains the following sections:
Schedules Tab
The Schedules tab in the Admin Console page is accessible to the system admins (superuser) and organization admins (jasperadmin).
List of All Schedules
All scheduled jobs that the user has defined appear in the Schedules tab of the Manage>Admin Console page. In the Schedules page, you can search, sort, add filter, refresh, and download a scheduled report. For more information on these operations, see the List of Scheduled Jobs section in the JasperReports Server User Guide.
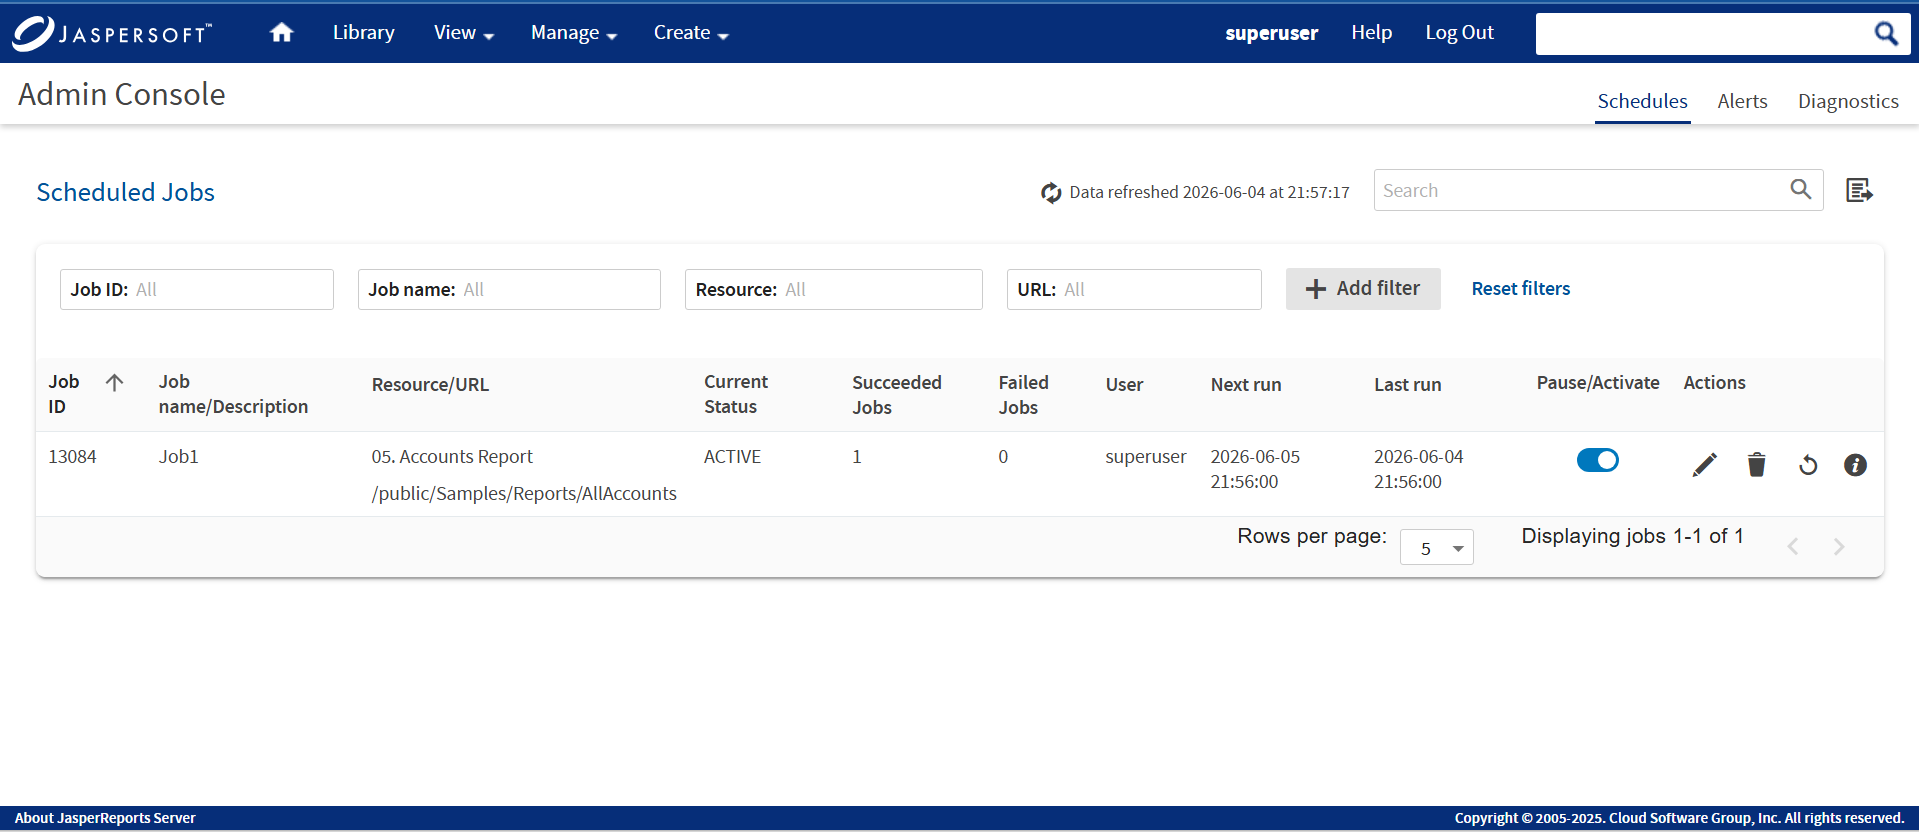
Figure 1 Schedules Page
Typical users can see only the jobs that they have defined. Administrators can view the jobs defined by all users.
The Schedules page shows the following:
| Column Name | Description |
|---|---|
| Job ID | The unique identifier of a job. |
| Job name/Description | Name of the scheduled job and description. |
| Resource/URL | Repository URL of the job. |
| Current Status | The status of the job in NORMAL, EXECUTING, COMPLETE, PAUSED, ERROR, or UNKNOWN state. |
| Succeeded Jobs | The jobs that are completed successfully without any errors. |
| Failed Jobs | The jobs that are triggered but encountered an error and did not complete successfully. |
| User | The owner who created the job. |
| Next run | Filters by date and time to view the count and list of schedules that will run next at the filtered time. |
| Last run | Filters by date and time to view the count and list of schedules that was run last at the filtered time. |
| Pause/Activate | Enable or disable the job. |
| Actions | Edit, delete, restart the job and show execution logs. |
Editing a Schedule
To edit a scheduled job for a report
-
Click Manage> Admin Console > Schedules.
-
Click the Edit icon
 in the row of the job that you want to update.
 -
Edit the fields in the Schedule, Parameters, Output Options, and Notifications tabs.
Note
See Creating a Schedule section in the JasperReports Server User Guide and repeat from steps 4-10.
-
Click Save. The update occurs immediately.
Pausing a Job
To stop a job from running without deleting it, disable the job.
To pause a scheduled job:
-
Click Manage>Admin Console > Schedules.
-
In the row of the job that you want to stop, disable the Pause/Activate toggle switch.
Note
You can resume the job by enabling the Pause/Activate toggle switch. When a stopped job is re-enabled, it waits until the next scheduled time to run.
Deleting a Job
To delete a scheduled job:
-
Click Manage> Admin Console > Schedules.
-
Click the delete icon
 in the row of the job you want to delete. A confirmation dialog with a warning message is displayed to confirm if you want to delete this job.
If the delete request is sent for the job that is still running, the server completes running the job before deleting it.
-
Click Delete to delete the scheduled job else click Cancel to cancel the delete action.
-
Click Close to close the Scheduled job panel.
Showing Execution Logs
The execution logs shows the following:
| Column Name | Description |
|---|---|
| Start Time | The exact time when the scheduled job started running. |
| Status | Indicates whether the execution was successful or failed. |
| End Time | The exact time when the job finished running (whether successfully or with an error). |
| Execution Time | The total duration the job took to complete. |
| Error | Displays the detailed failure diagnostics for failed jobs |
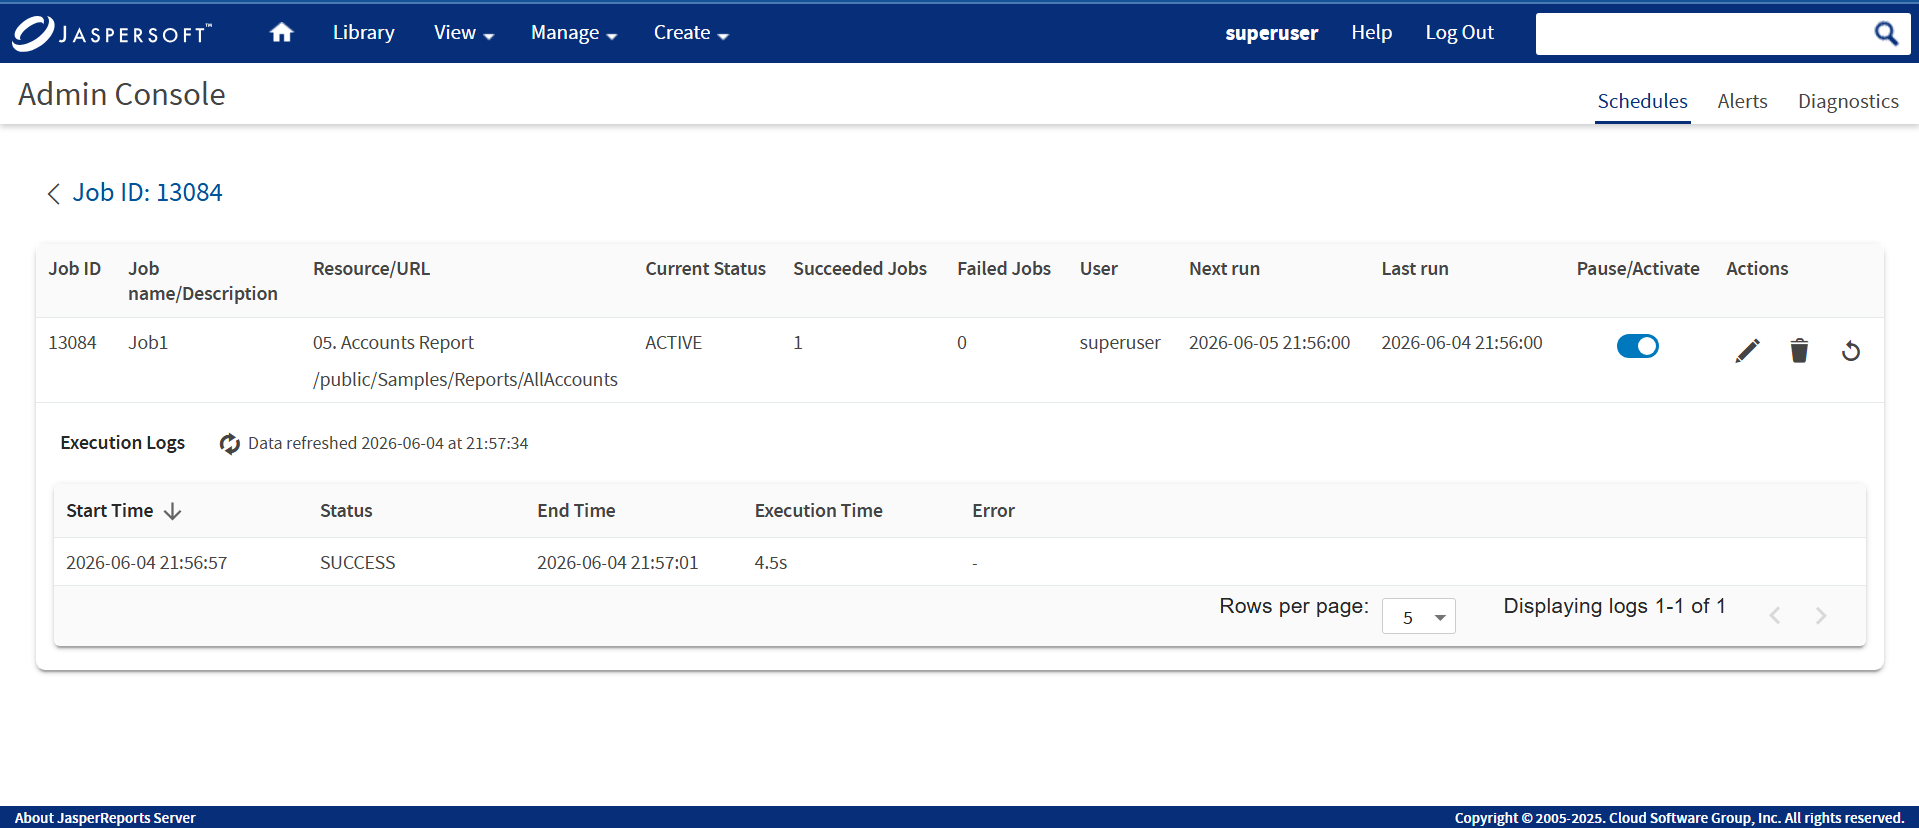
Execution Logs Page
Alerts Tab
The Alerts tab is the new feature in the Admin Console page. You can view the list of all the report alerts in the Alerts tab. System admin (superuser) and organization admin (jasperadmin) have complete access to view report alerts in the Admin Console. The superuser can view the list of report alerts for all the users and the jasperadmin can view alerts of their respective organization. Other users do not have access to the Admin Console page and can only view report alerts of the folders with permissions assigned.
Note
Currently, the Alerts tab in the Admin Console page is a new beta feature that may not be fully stable or supported. For more information on the Alerts Beta feature, see Admin Console Beta.
Diagnostics Tab
The Diagnostics tab in the Admin Console page provides a snapshot overview of your entire Jaspersoft system. Only the system admin (superuser) can view the diagnostic information. This user interface lets you quickly and easily view the status of license validity date, repository - database, configuration, size, total count of reports run, product details, and so on.
The following figure shows all the diagnostics information that the user has defined appear in the Diagnostics tab of the Manage>Admin Console page.
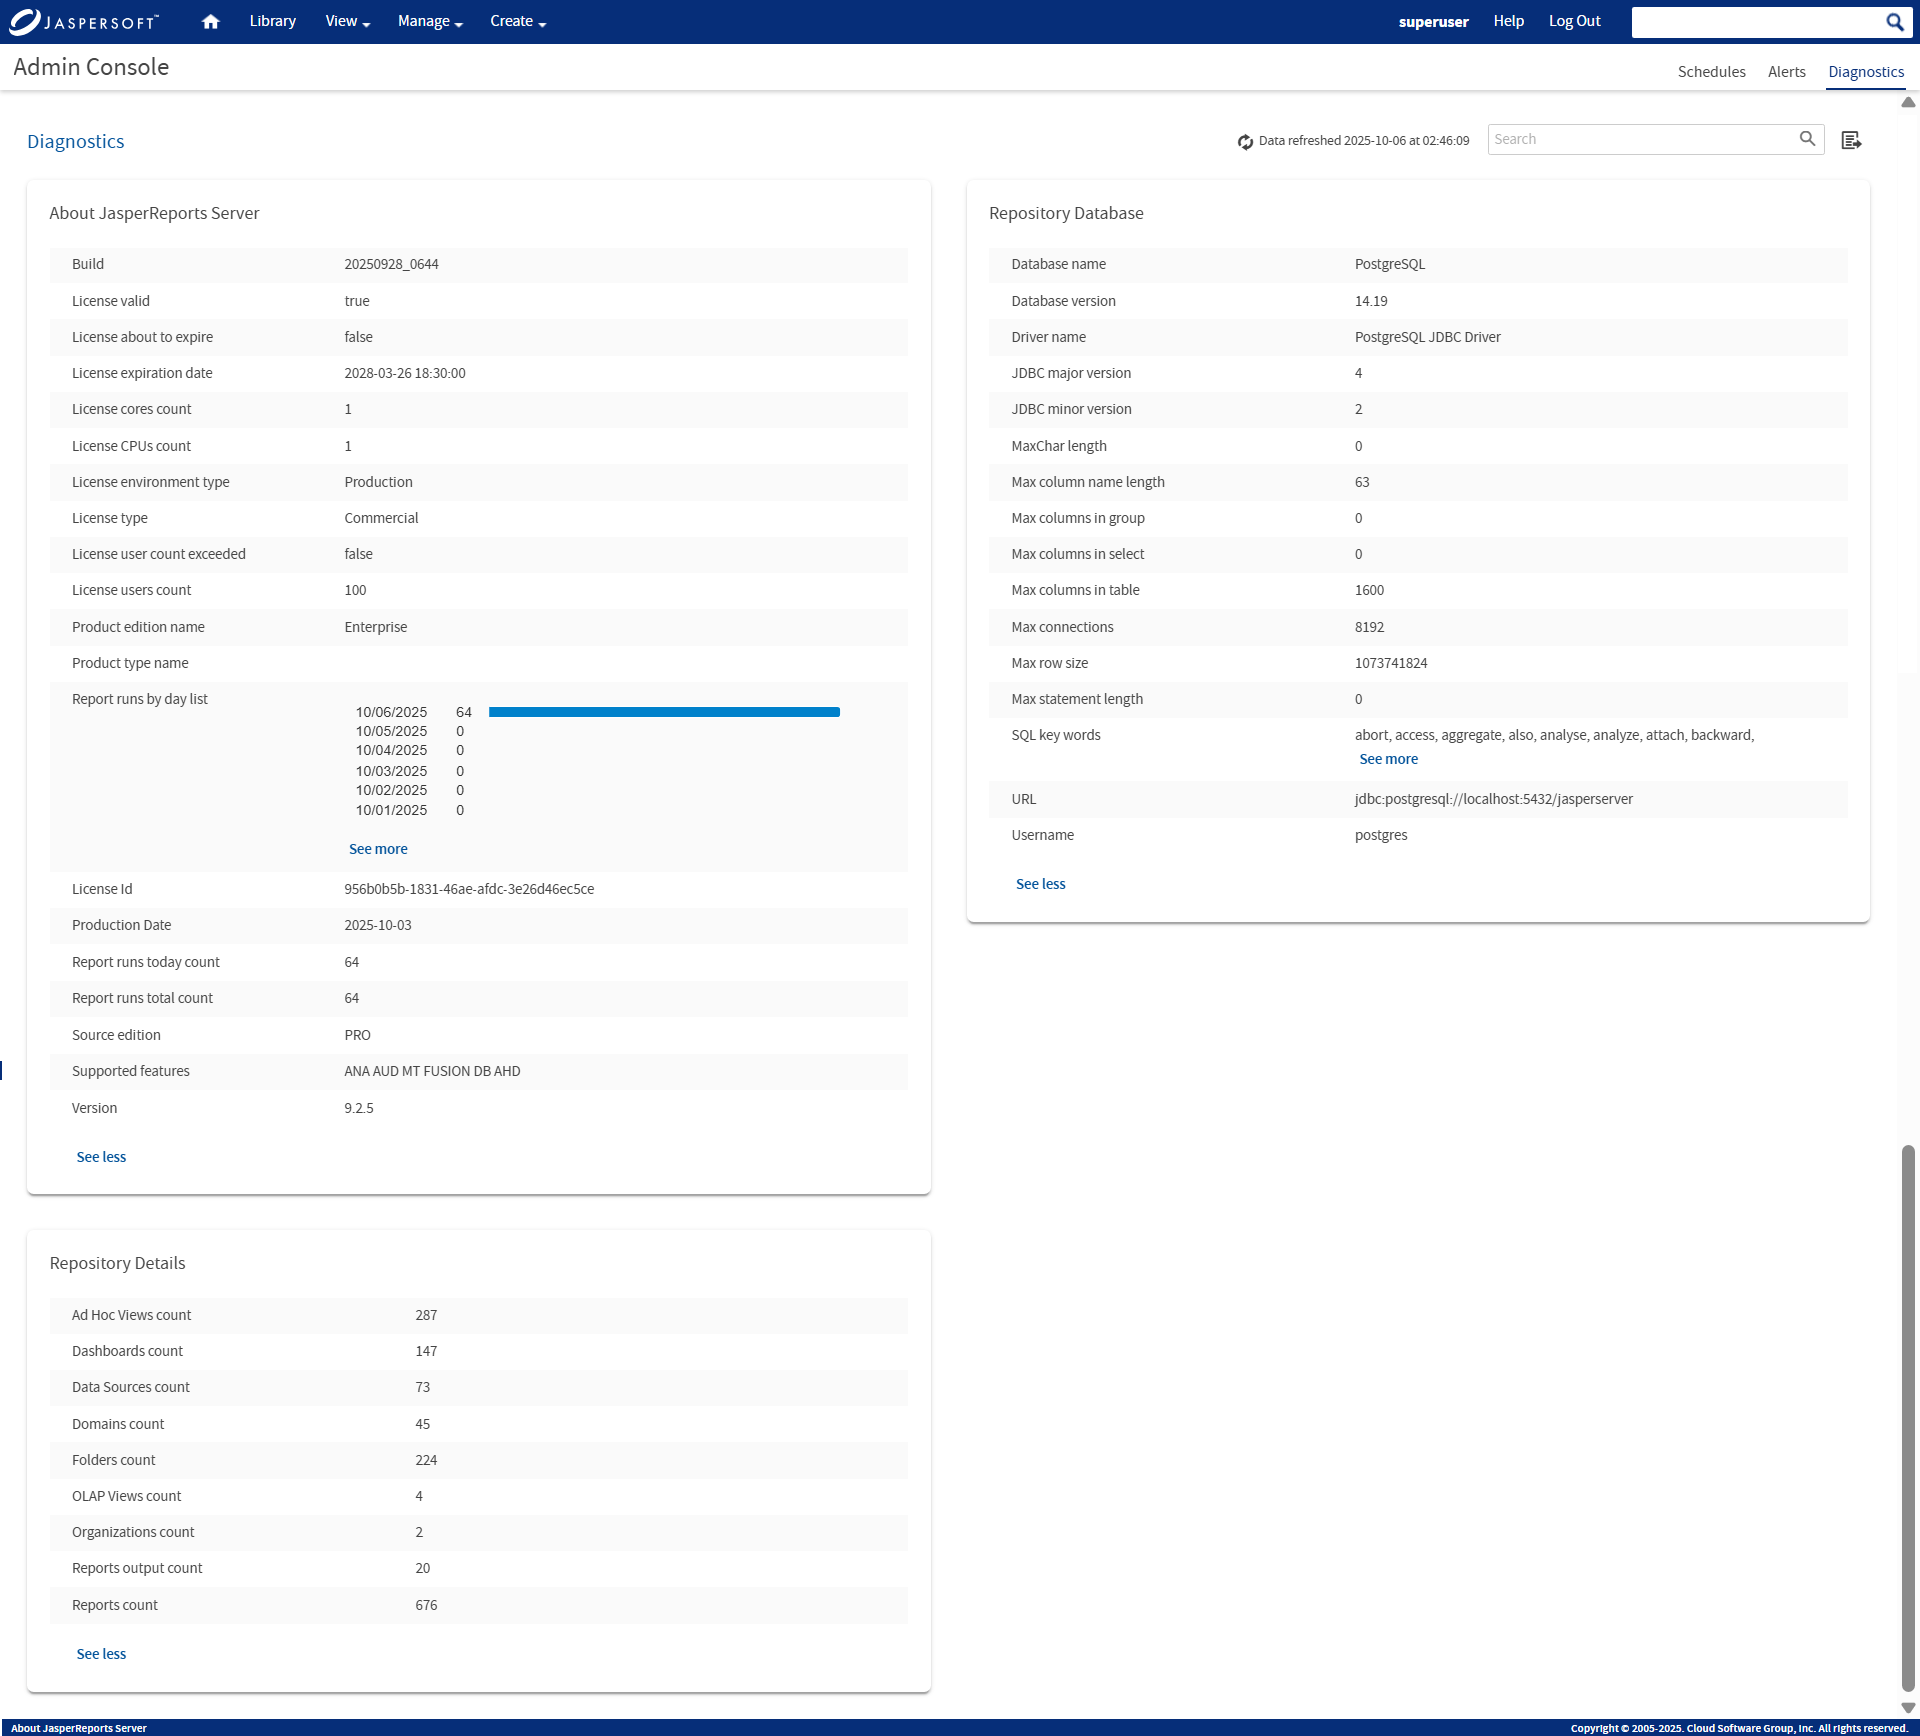
Figure 2 Diagnostics Page
The Diagnostics page includes the following controls:
| Diagnostics Page Controls | Description |
|---|---|
 |
Displays the latest updated diagnostics information with the recent date and time. |
 |
Displays the search term. |
 |
Downloads the diagnostic information of the report in CSV format. |
| See more | Expands the list of information for Report runs by day list, SQL key words, and Repository Details. |
| See less | Collapse the list of viewed information for Report runs by day list, SQL key words, and Repository Details. |
The See more and See less controls lets you expand or collapse the viewed information in the Diagnostics page.
The information of the report displayed in the Diagnostics tab can be viewed on the View>Repository page. For more information on the diagnostics, refer to the Using the Diagnostic Data in Reports.