Example of a Tile Map Chart
This example shows how to create a tile map chart.
To create the report for the chart
-
Create a new, blank report using the Sample DB data adapter and the query:
SELECT "hc_a2", "name", "region", "x", "y", "population" FROM (VALUES('AL', 'Alabama', 'South', 6, 7, 4849377),('AK', 'Alaska', 'West', 0, 0, 737732),('AZ', 'Arizona', 'West', 5, 3, 6745408),('AR', 'Arkansas', 'South', 5, 6, 2994079),('CA', 'California', 'West', 5, 2, 39250017))s("hc_a2", "name","region", "x", "y", "population") -
Click Next.
-
Click
 to select all fields, then click Finish.
 -
Delete all bands except for Title and Summary.
-
Enlarge the Summary band to 500 pixels by changing the Height entry in the Band Properties view.
To create the chart
-
Click
 HTML5 Charts in the Components Pro section of the Palette. The cursor changes to
  to show that an element is selected. Click and drag in the Summary band to size and place the chart. The HTML5 Chart Edit Dialog appears.
 -
Select a chart type based on the information that you want to display. You can use the menu on the left to restrict the selection to a particular type of chart. For this example, choose TileMap.
-
On the Data Configuration tab of the HTML5 Chart Edit Dialog, click Switch to advanced configuration.
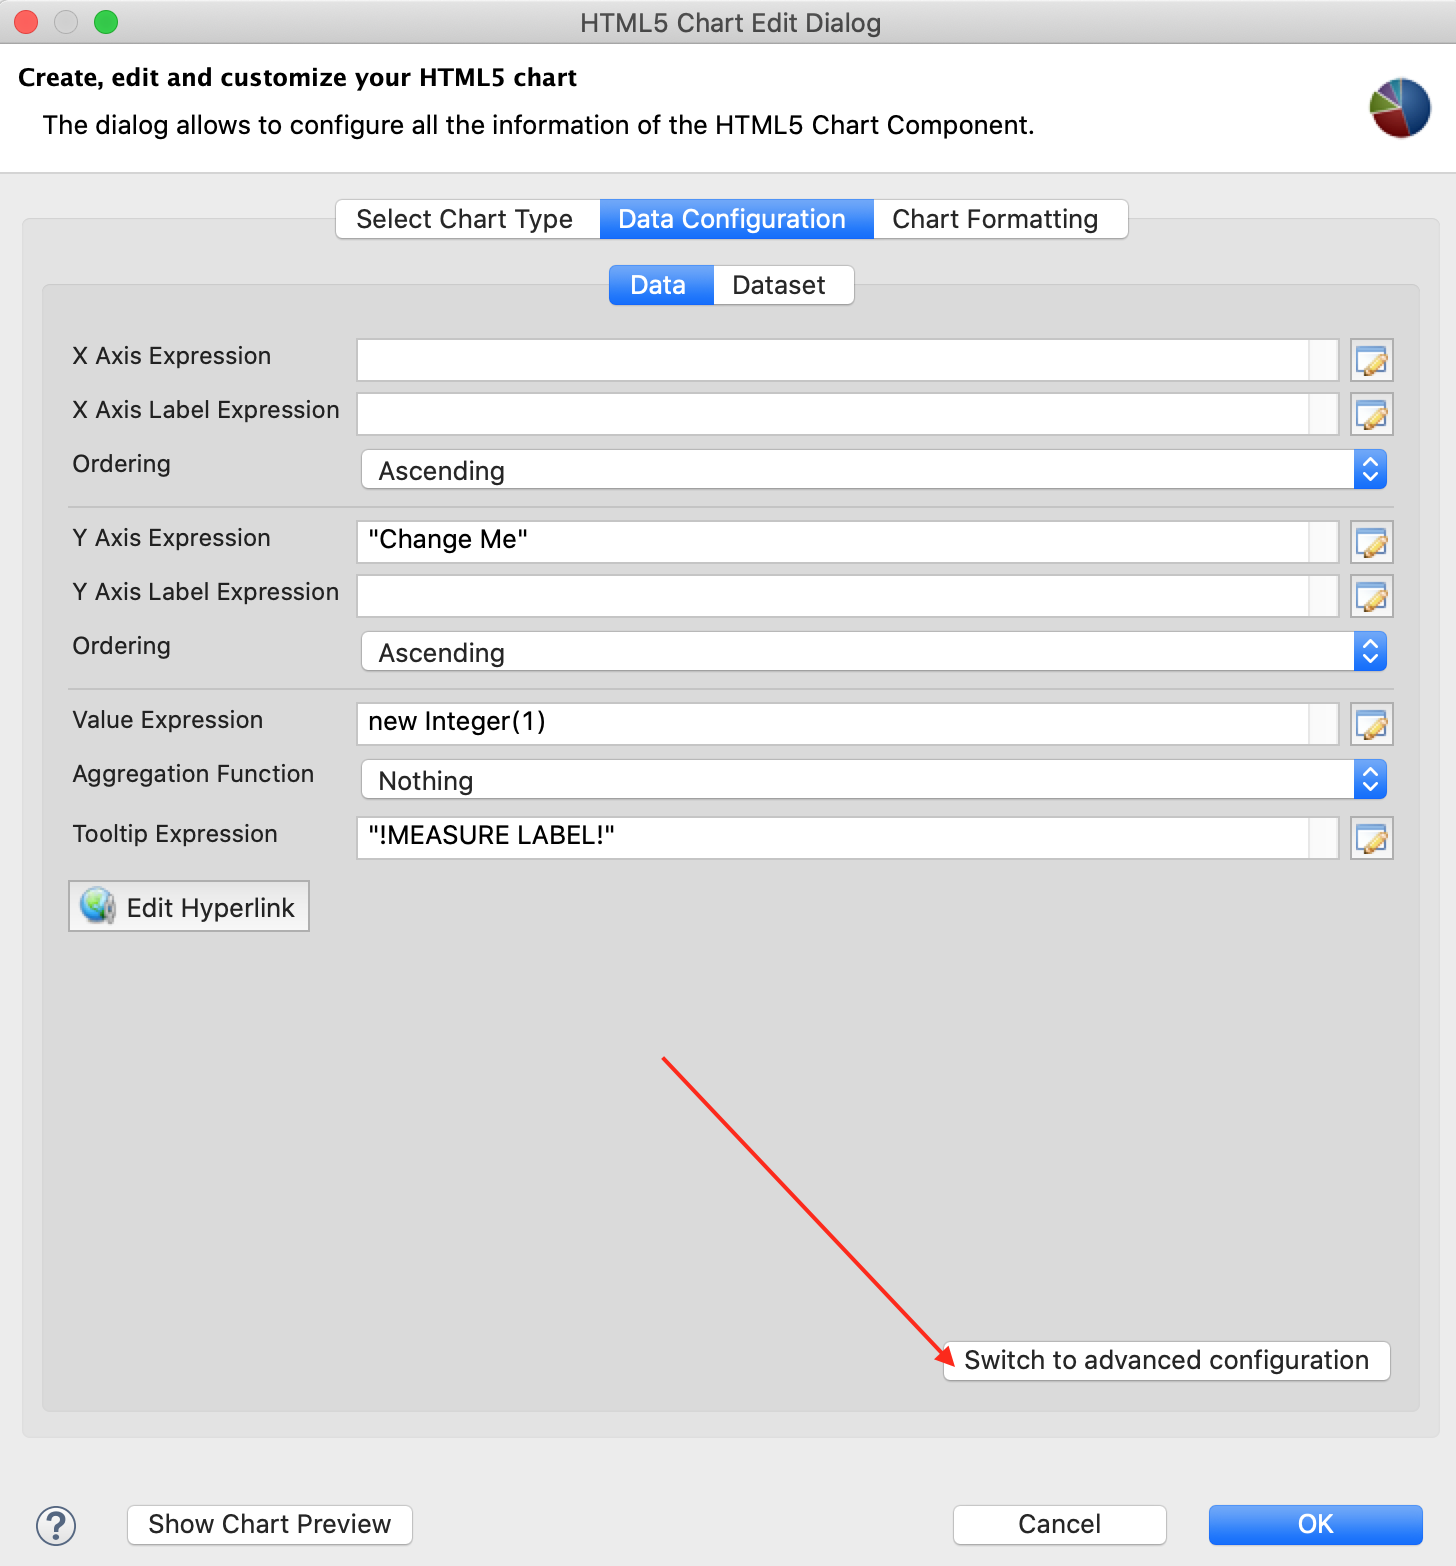
Figure 1 HTML5 Charts Properties > Chart Data > Configuration -
Under Categories Levels, select Level1 and click Modify. Then enter the following:
-
Expression:
$F{y}-
Value Class Name:
java.lang.IntegerClick OK.
- Under Series Level, select Series1 and click Modify. Then enter the following:
-
Expression:
$F{x} -
Value Class Name:
java.lang.IntegerClick OK.
- Under Measures, select Measure1 and click Modify. Then enter the following:
-
Value Expression:
$F{population} -
Value Class Name:
java.lang.IntegerClick OK.
You can optionally add other hidden measures, for example:
-
for
$F{hc_a2}: Value Expression:$F{hc_a2}and Value Class Name:java.lang.String. -
for
$F{name}- Value Expression:$F{name}and Value Class Name:java.lang.String.-
Click the Chart Formatting tab, select Chart > Title on the left and enter your title in the Title text box. For this example, enter
US states by population in 2016. -
Select Subtitle and enter Subtitle in the Subtitle text box. For this example, enter
Source: Wikipedia. -
On the Chart Formatting tab, select Tilemap on the left. You can set two additional properties of the tilemap chart: Tile Shape and Color By Point.
-
Select the tile shape from the drop-down. For this example, Tile Shape is Hexagon and Color By Point is set to false.
The default tile shape is Hexagon, but you can also select Circle, Diamond, or Square. If Color By Point is set to true, any tile in the chart is colored with consecutive colors in the 'Colors' chart property. The Color By Point property can be neglected when colors are defined in the colorAxis property.
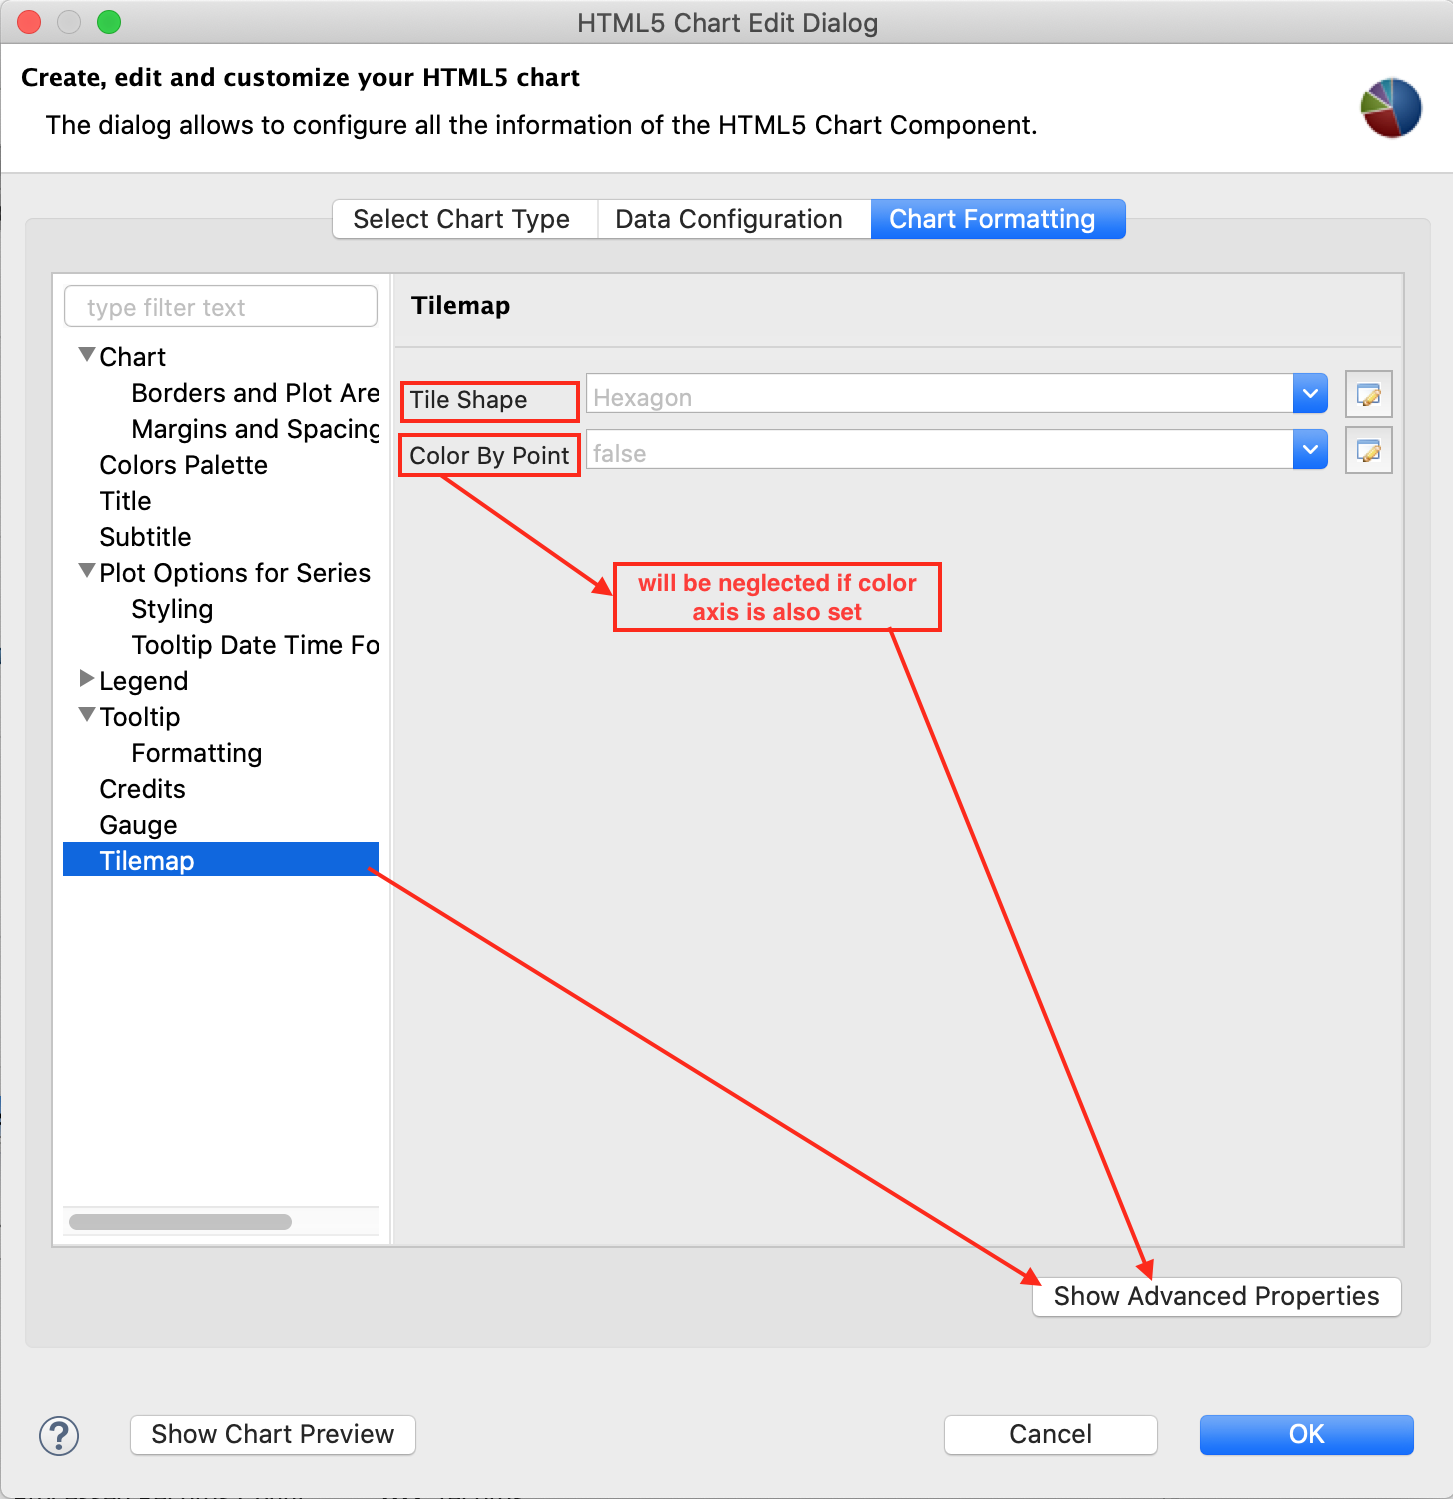
Figure 2 Setting Tile Shape and Color By Point -
Click Show Advanced Properties.
-
To configure the chart legend, select the colorAxis > dataClasses. Edit property array dialog appears.
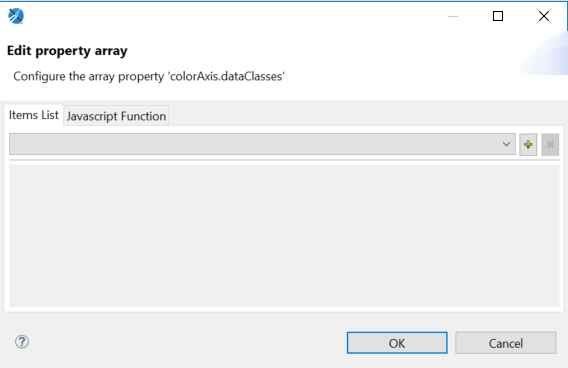
Figure 3 Edit property array dialog -
On the Item list tab, click
 to add an item. A new item is created with the name Item 1. Enter the following information.
-
-
colorAxis.dataClasses.color:
#F9EDB3 -
colorAxis.dataClasses.name: <1M
-
colorAxis.dataClasses.to: 1000000
- To add a second item, click and enter the following information.
- To add a second item, click
-
colorAxis.dataClasses.color:
#FFC428 -
colorAxis.dataClasses.from: 1000000
-
colorAxis.dataClasses.name: 1M-5M
-
colorAxis.dataClasses.to: 5000000
-
Click OK.
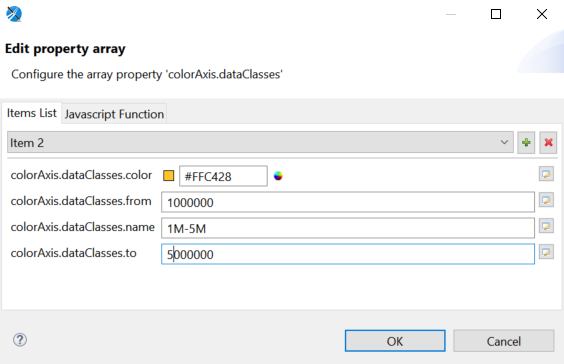 |
| Figure 4 Adding Required Information for Items |
- To enable the labels to appear in each tile map, select plotOptions > tilemap > dataLables and set enabled to true.
- To preview the chart from inside the dialog, click Show Chart Preview.
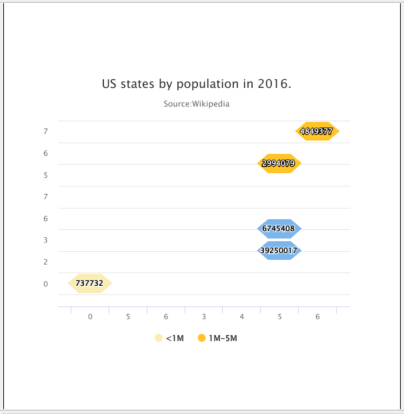 |
| Figure 5 Tile Map Example |