Creating your first report
This chapter takes you from a folder with a CSV file in it to a finished report: a list of sales grouped by country, with its preview and its exports. It takes about five minutes.
You need a folder with your data. The example uses sales.csv, a file like this:
country,customer,amount
Italy,Rossi Arredamenti,12450.00
Italy,Bianchi & Figli,8320.50
Germany,Becker Maschinenbau,21075.00
...
Open the folder in Jaspersoft Desktop (see Working with workspaces). If your CSV file is somewhere else, copy it into the folder, or use Import File in the explorer's + menu.
1. Tell Jaspersoft Desktop how to read the data
A report does not read a CSV file directly: it reads it through a data adapter, a small file that says where the data is and how to read it. The same data adapter can serve many reports.
- Click New Data Adapter on the empty page of the workspace, or choose Data Adapter in the explorer's + menu. A new data adapter opens in a tab.
- In the list on the left, choose CSV.
-
Fill in the form:
- Name: a name for you, for example
Sales. - CSV File Path or URL: the path of the file in the workspace, starting with
/, for example/sales.csv. The search button next to the field lets you pick it. - Use First Line As Header: tick it when the first line of the file holds the names of the columns, as in the example. These names become the fields of your report.
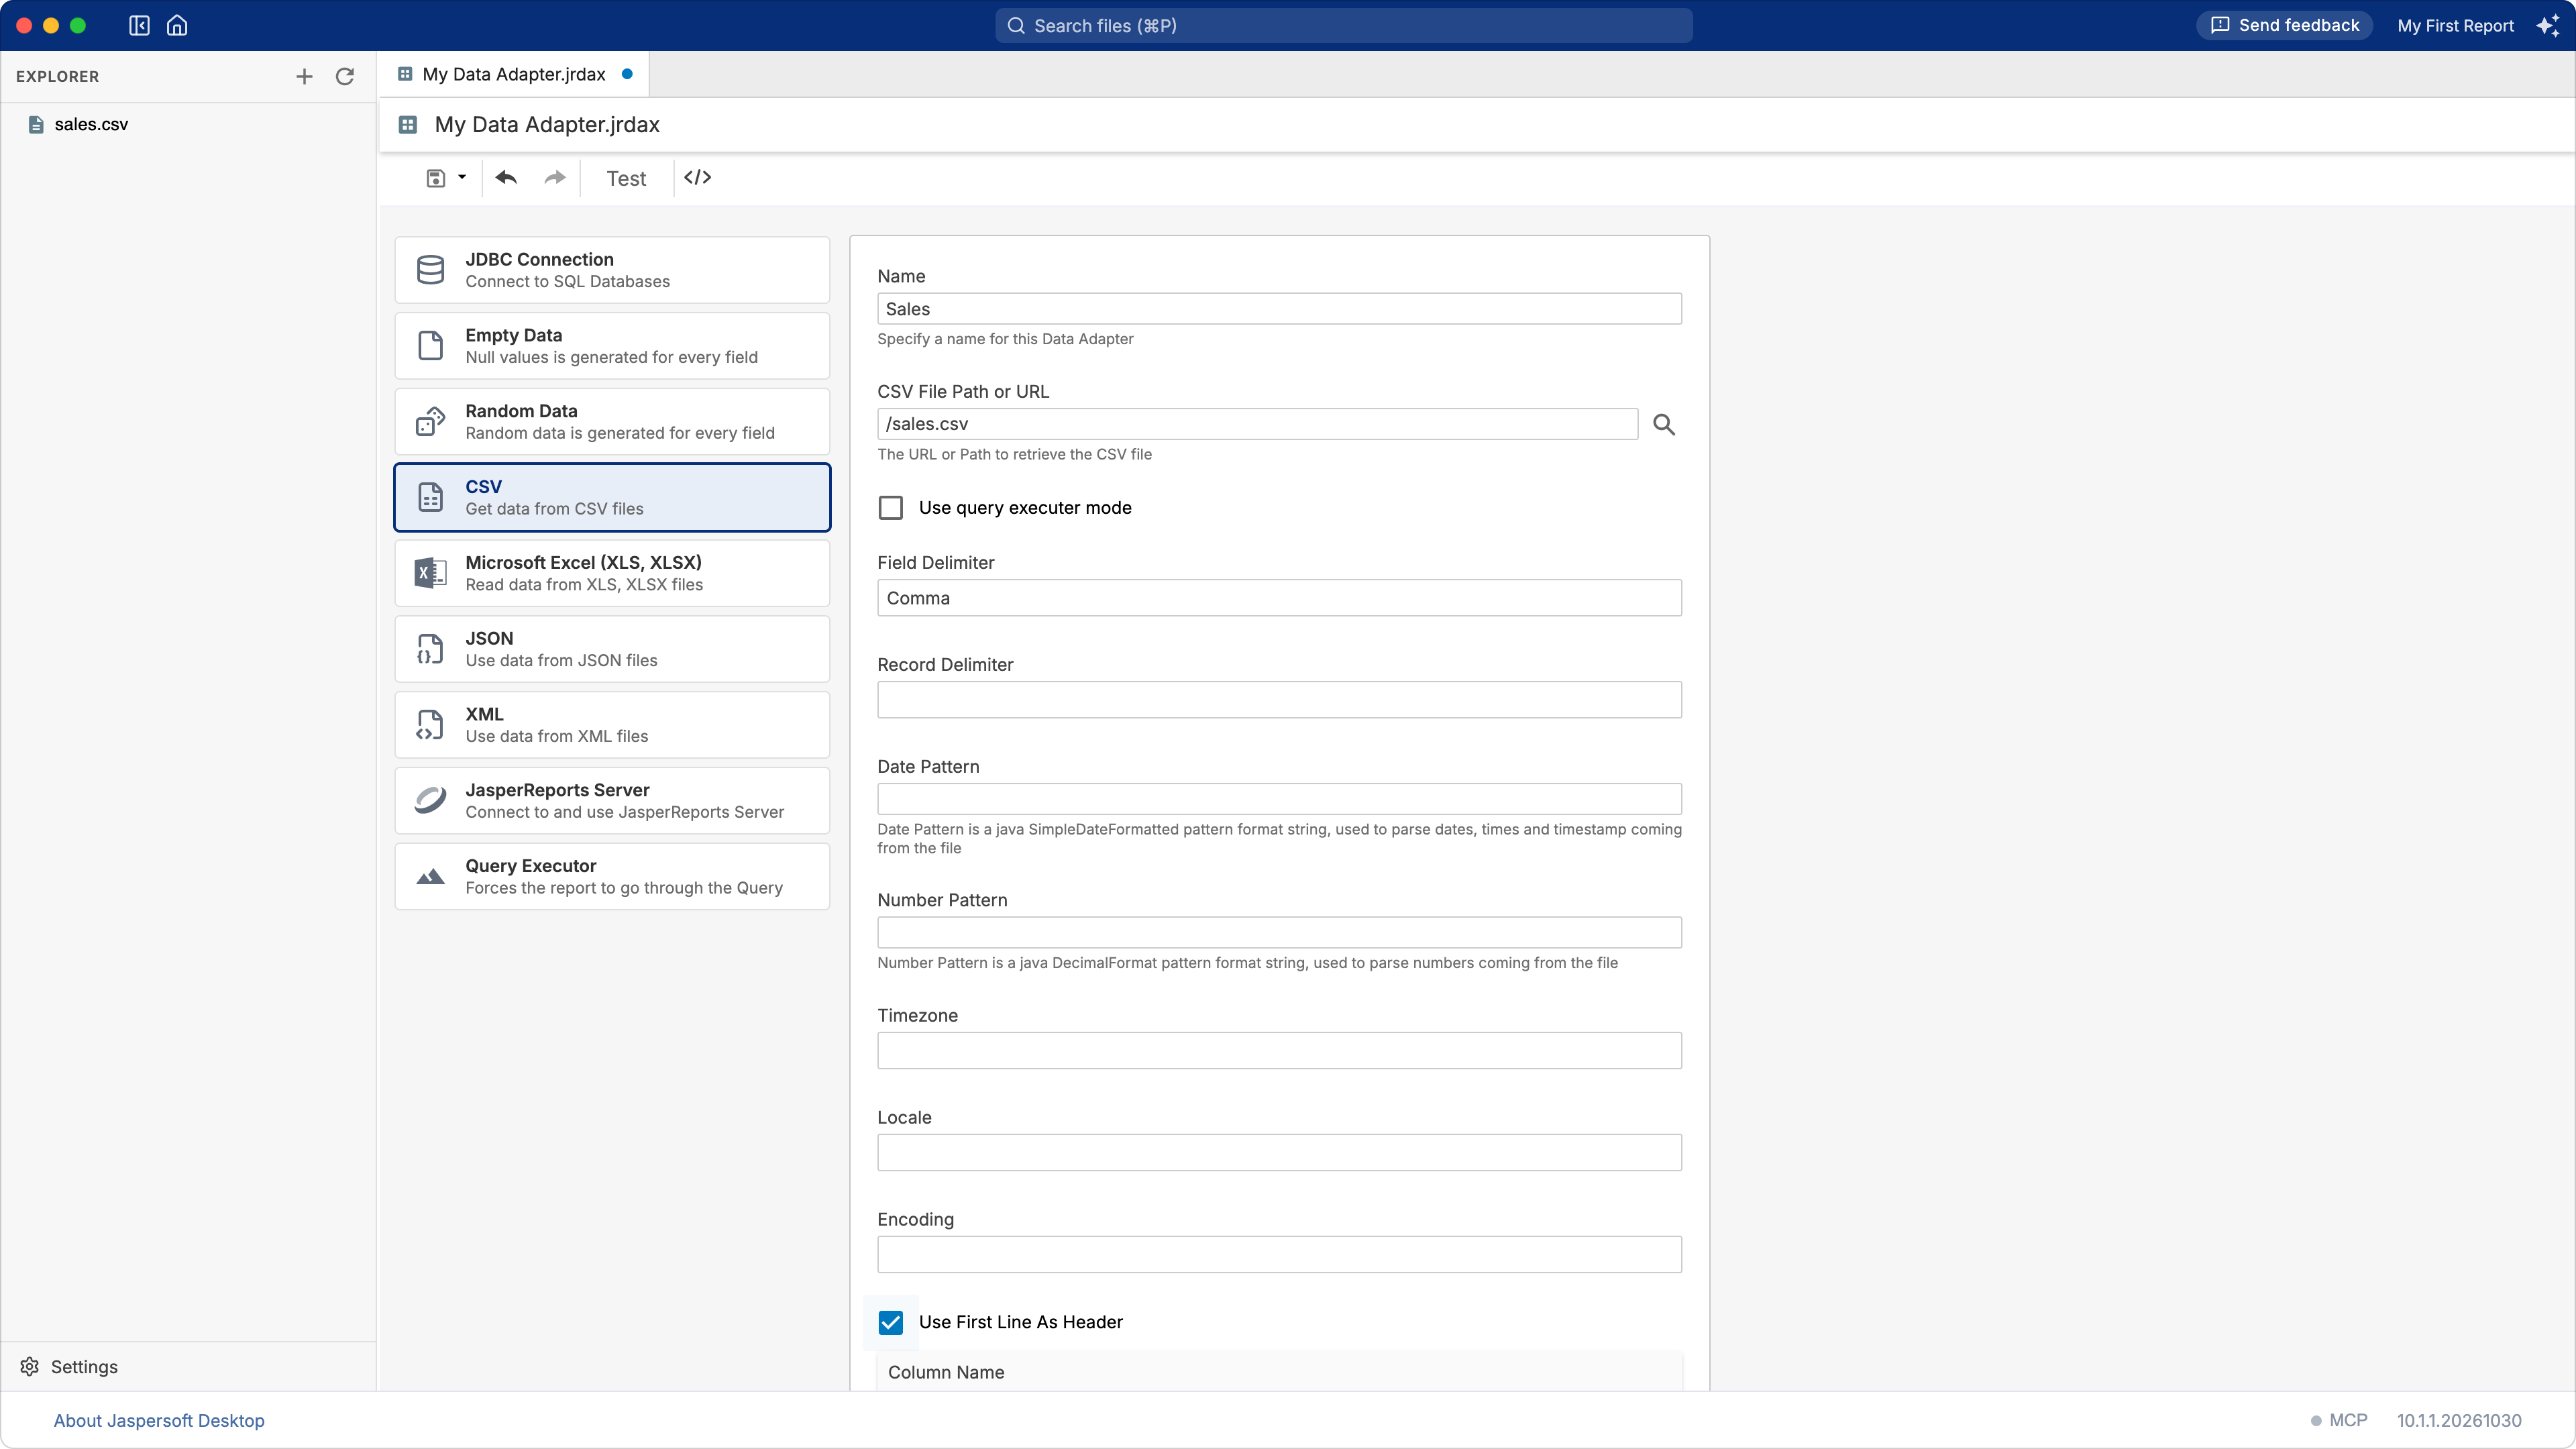
- Name: a name for you, for example
-
Click Test, in the toolbar of the data adapter. "Data Source successfully validated" means the file can be read.
- Save the data adapter (the save button of the toolbar, or ⌘S / Ctrl+S), with a name
ending in
.jrdax, for exampleSales.jrdax.
Working with data adapters explains the other options and the other kinds of data.
2. Create the report with the Report Wizard
Choose Report in the explorer's + menu (or click New Report on the empty page of the workspace). A new report opens, and the Report Wizard starts.
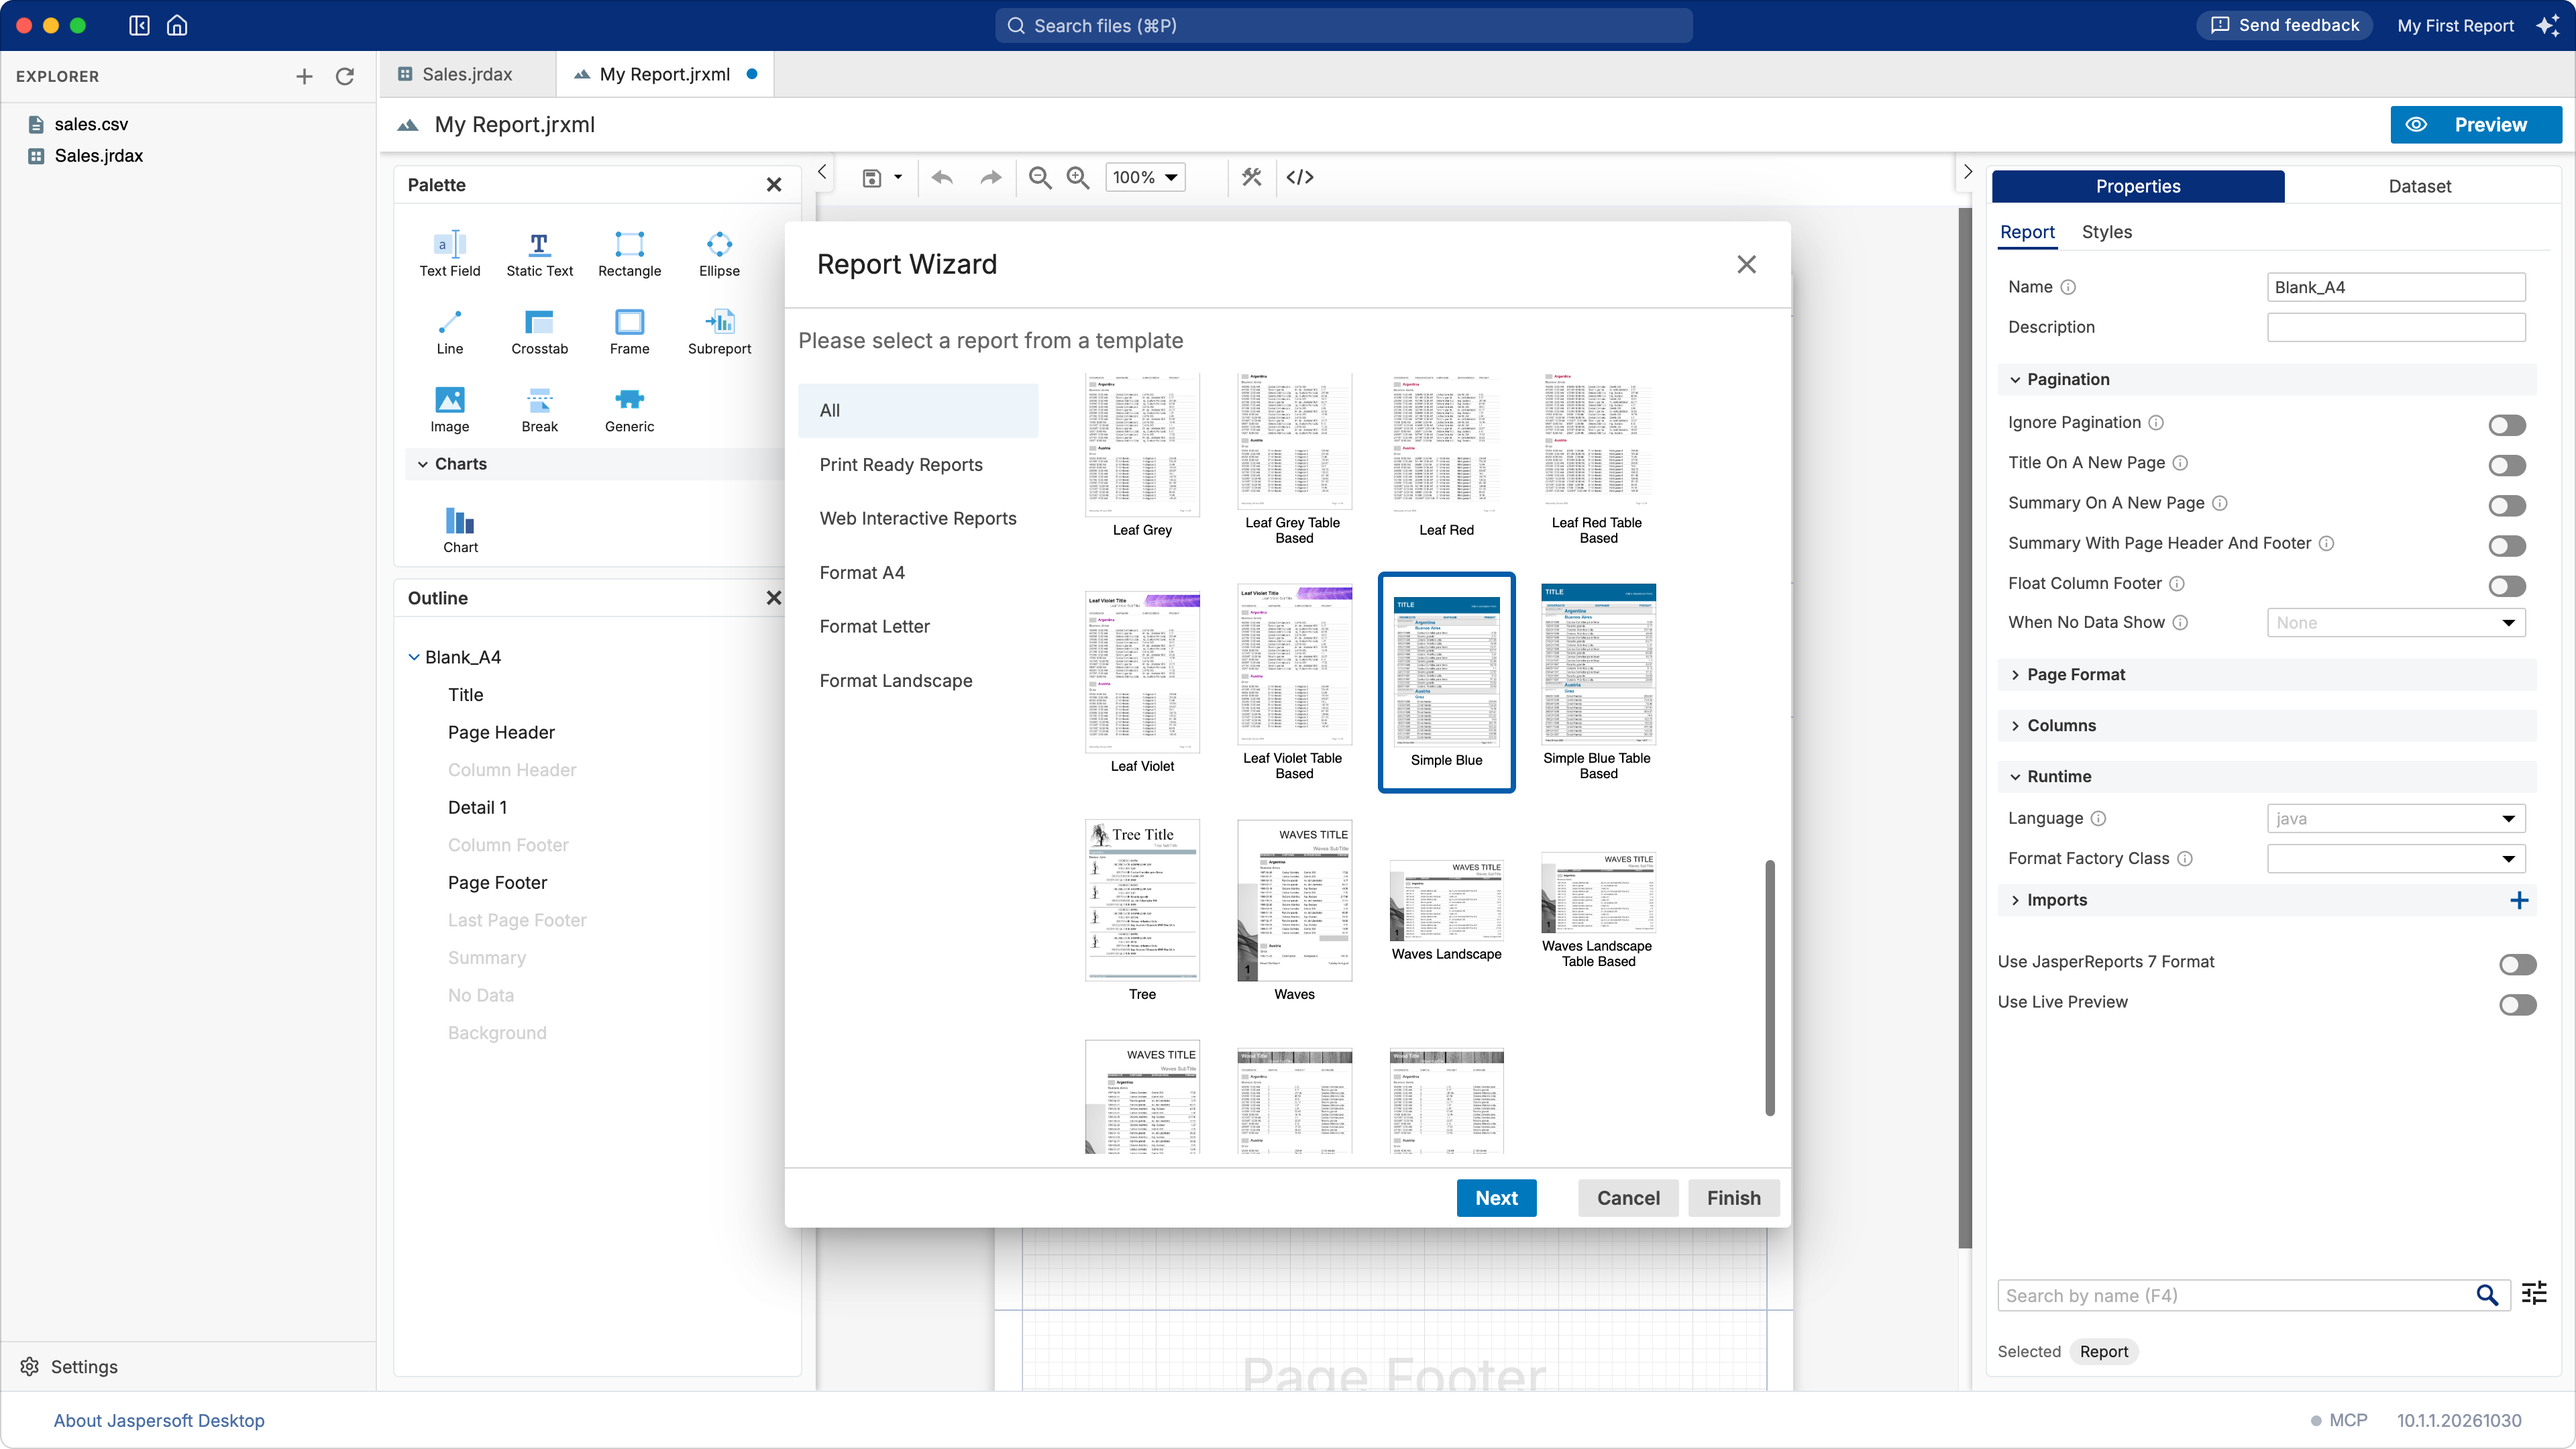
Choose a template. Templates give the report its look: pick one, for example Simple Blue. Print Ready Reports are laid out for printing and PDF, Web Interactive Reports are built on a table, for reading on screen.
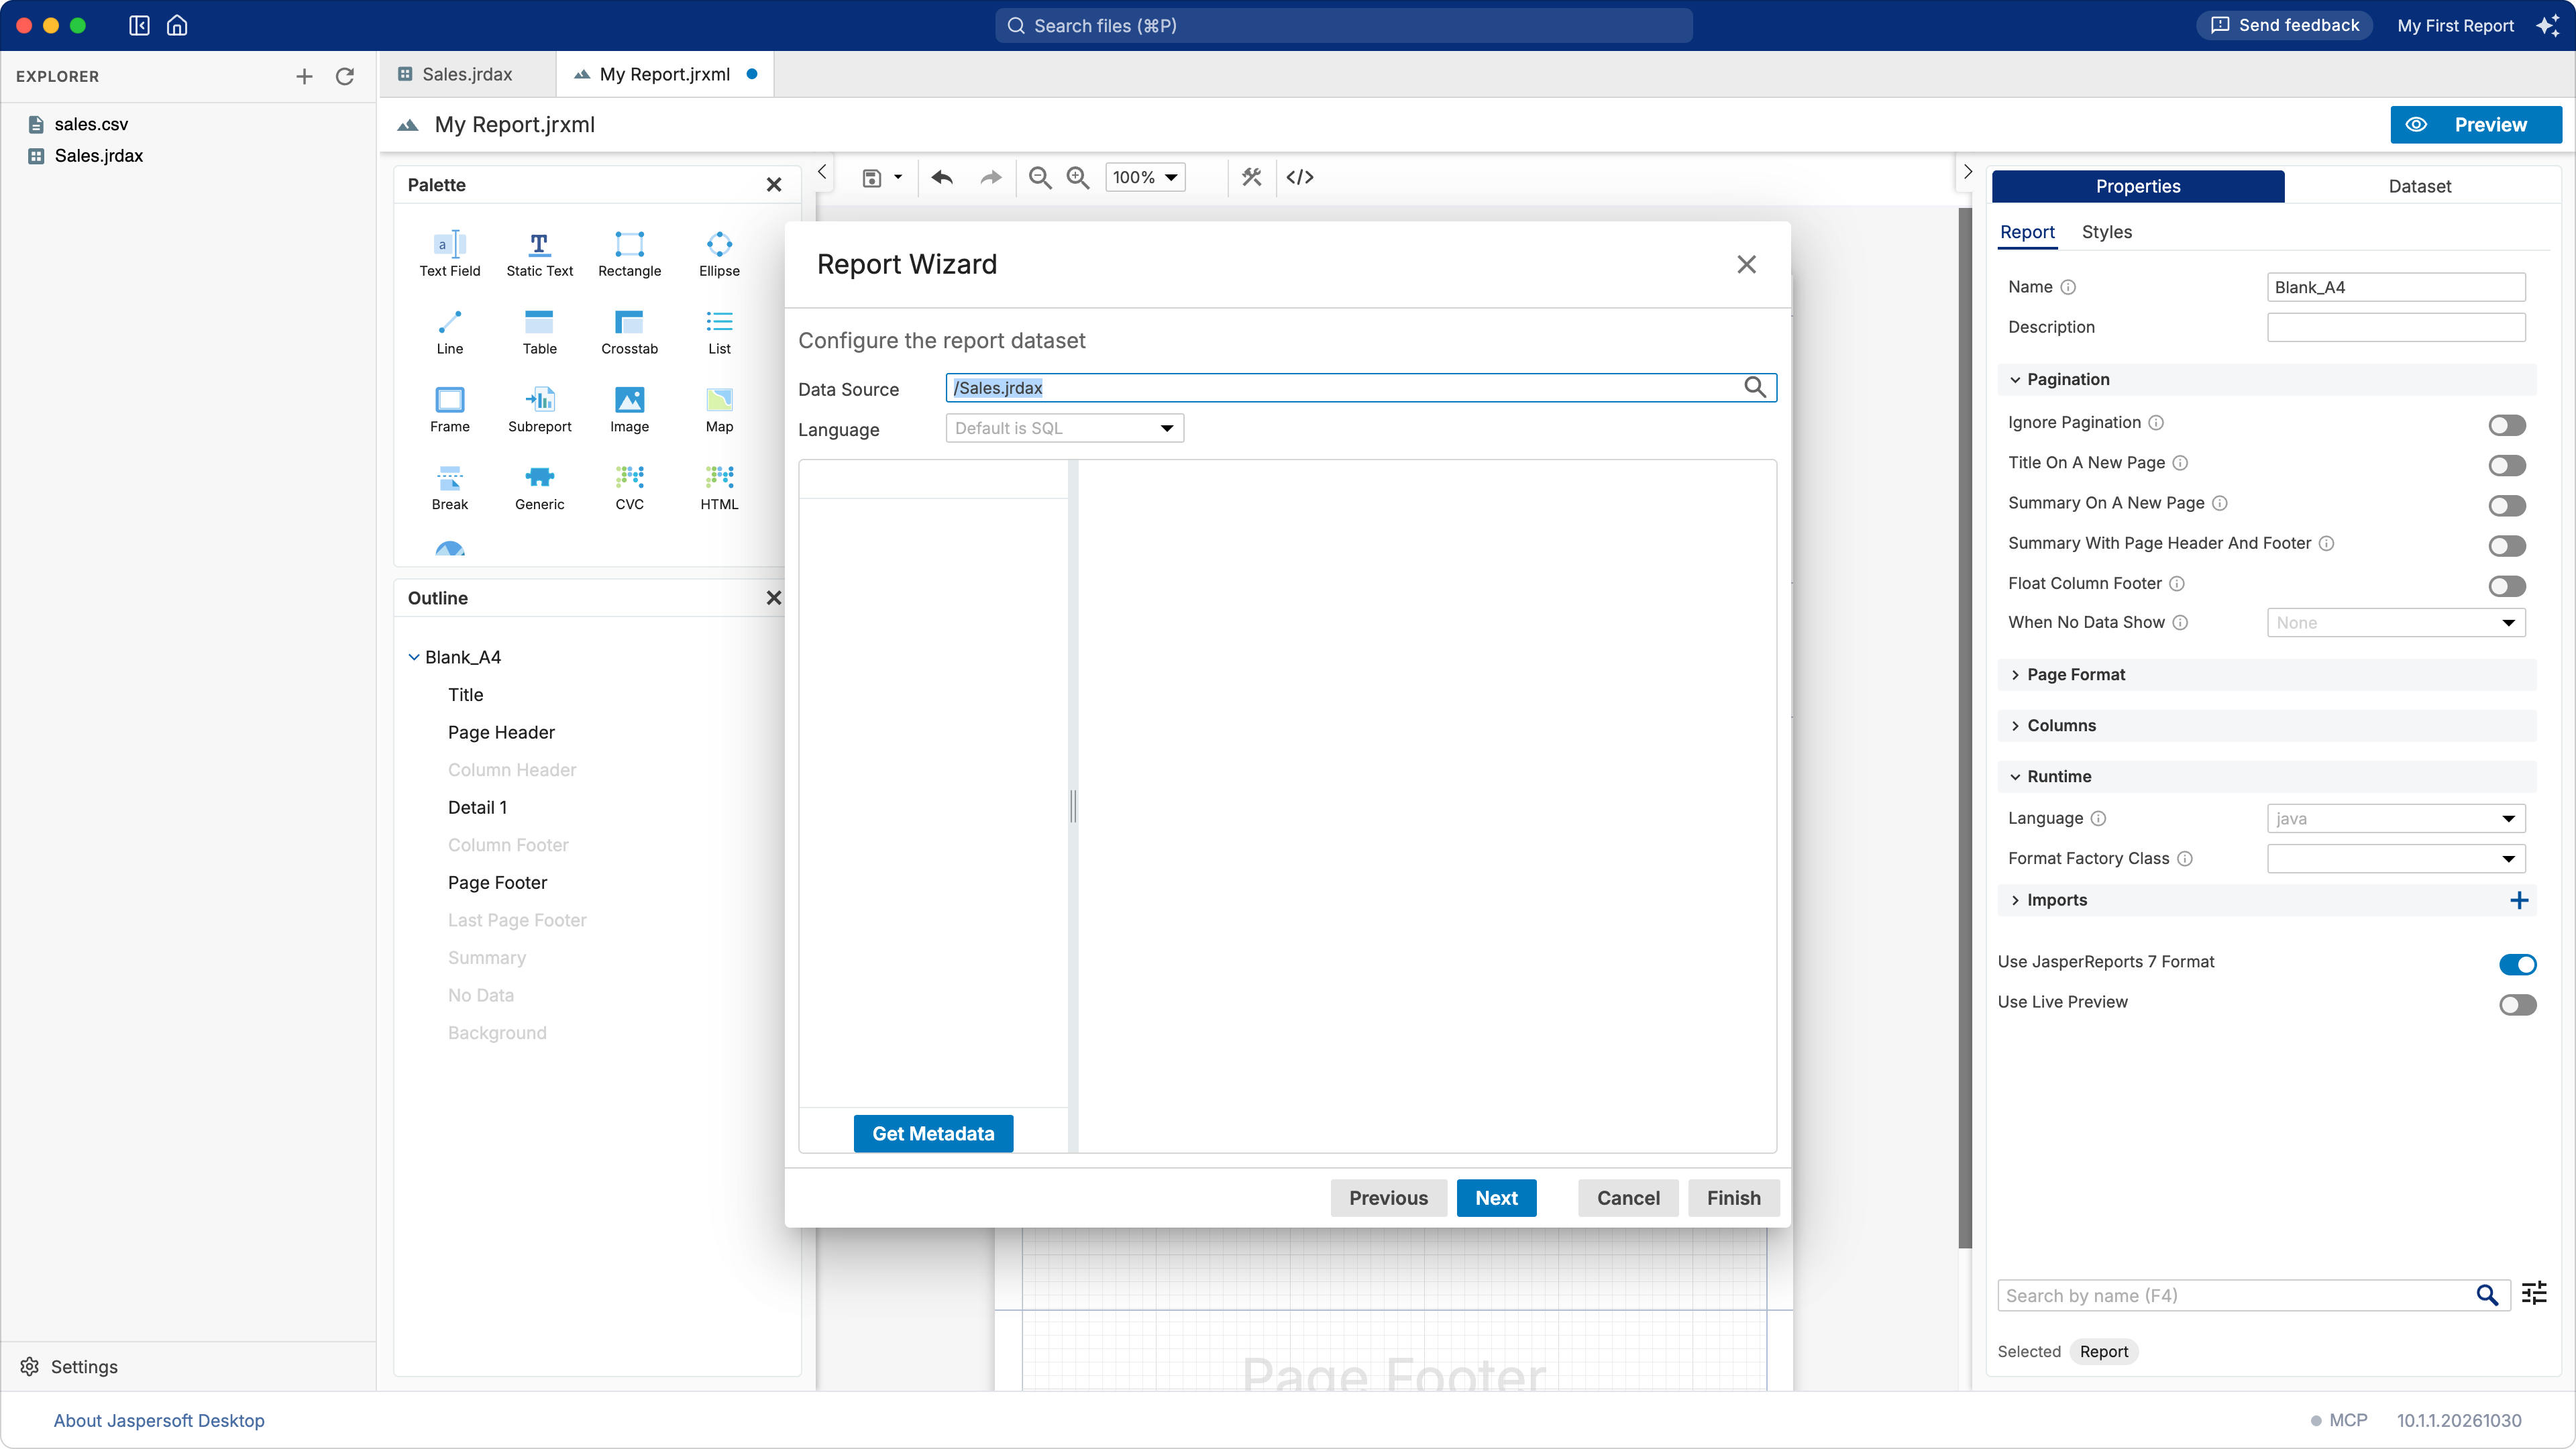
Choose the data. In Data Source, click the search button and choose the data adapter you
saved, Sales.jrdax. Leave Language as it is for a CSV file.
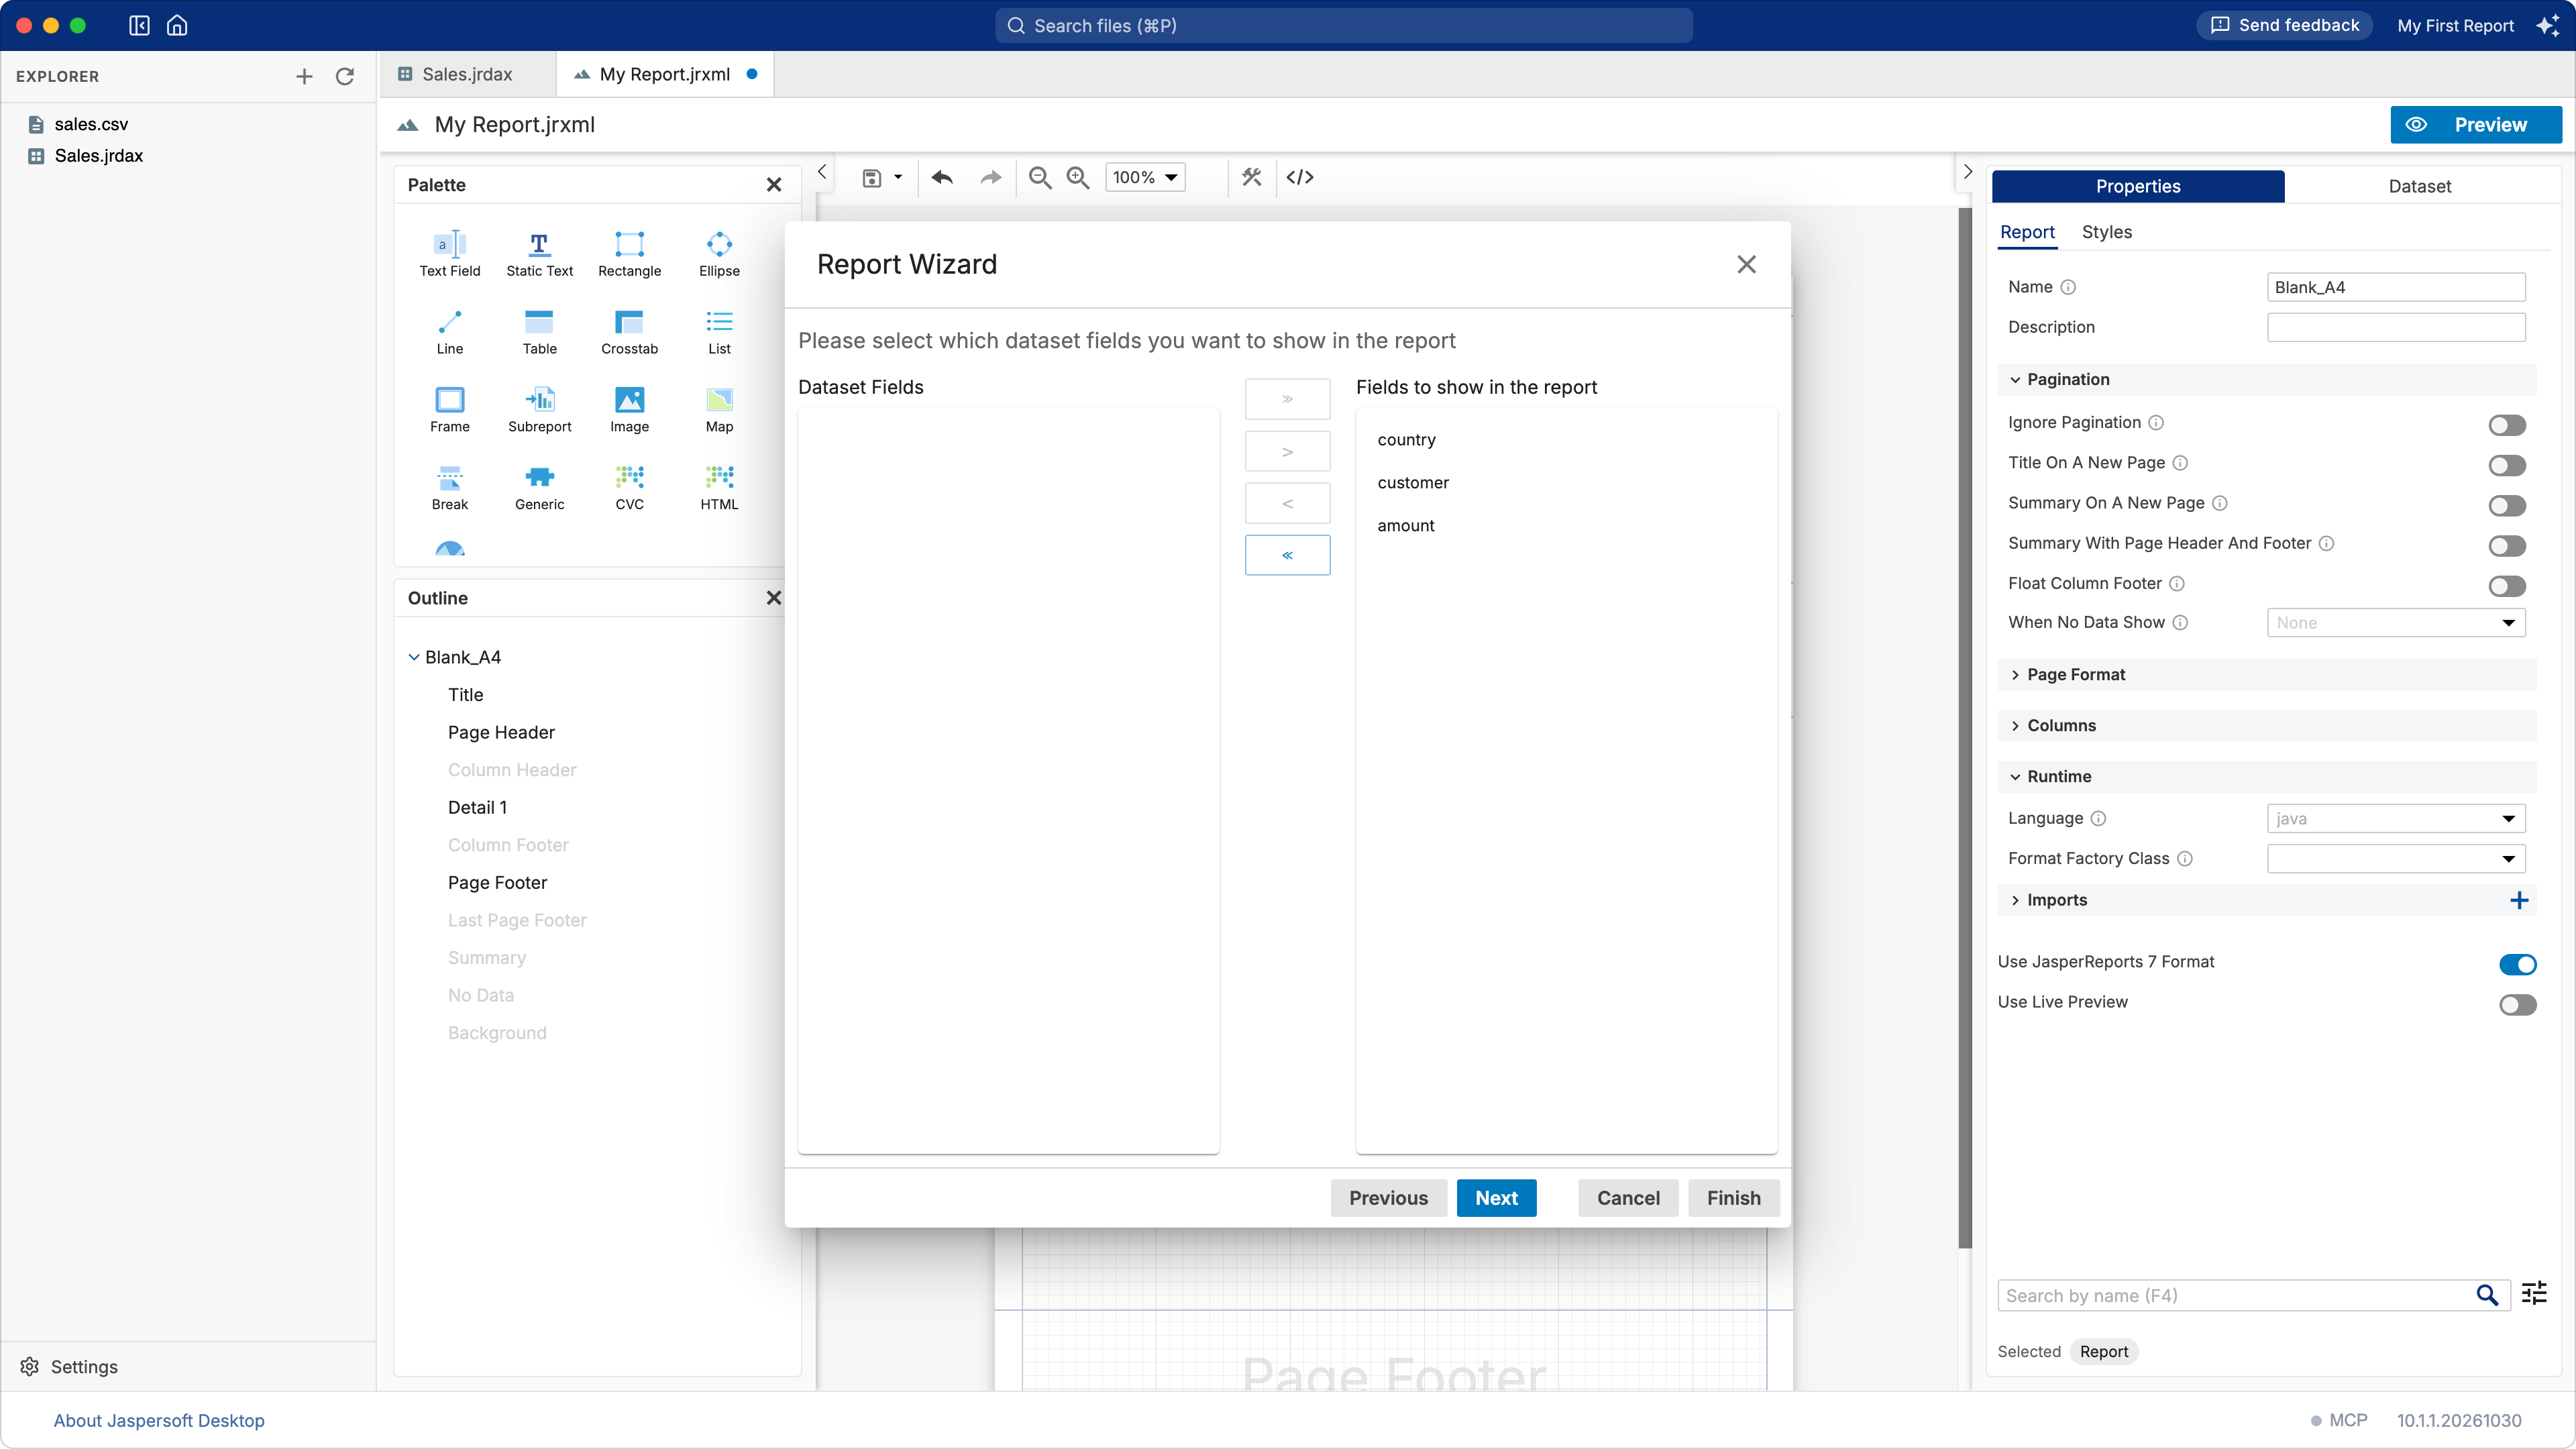
Choose the fields. The wizard reads the fields of the data. Move the ones you want in the report from Dataset Fields to Fields to show in the report, with the arrow buttons or by double-clicking them. Their order is the order of the columns.
Group the data (optional). Move a field to Group By to group the rows by its value: here
country, for a section for each country. Turn on Automatically sort records according to
defined groups when your data is not already in that order.
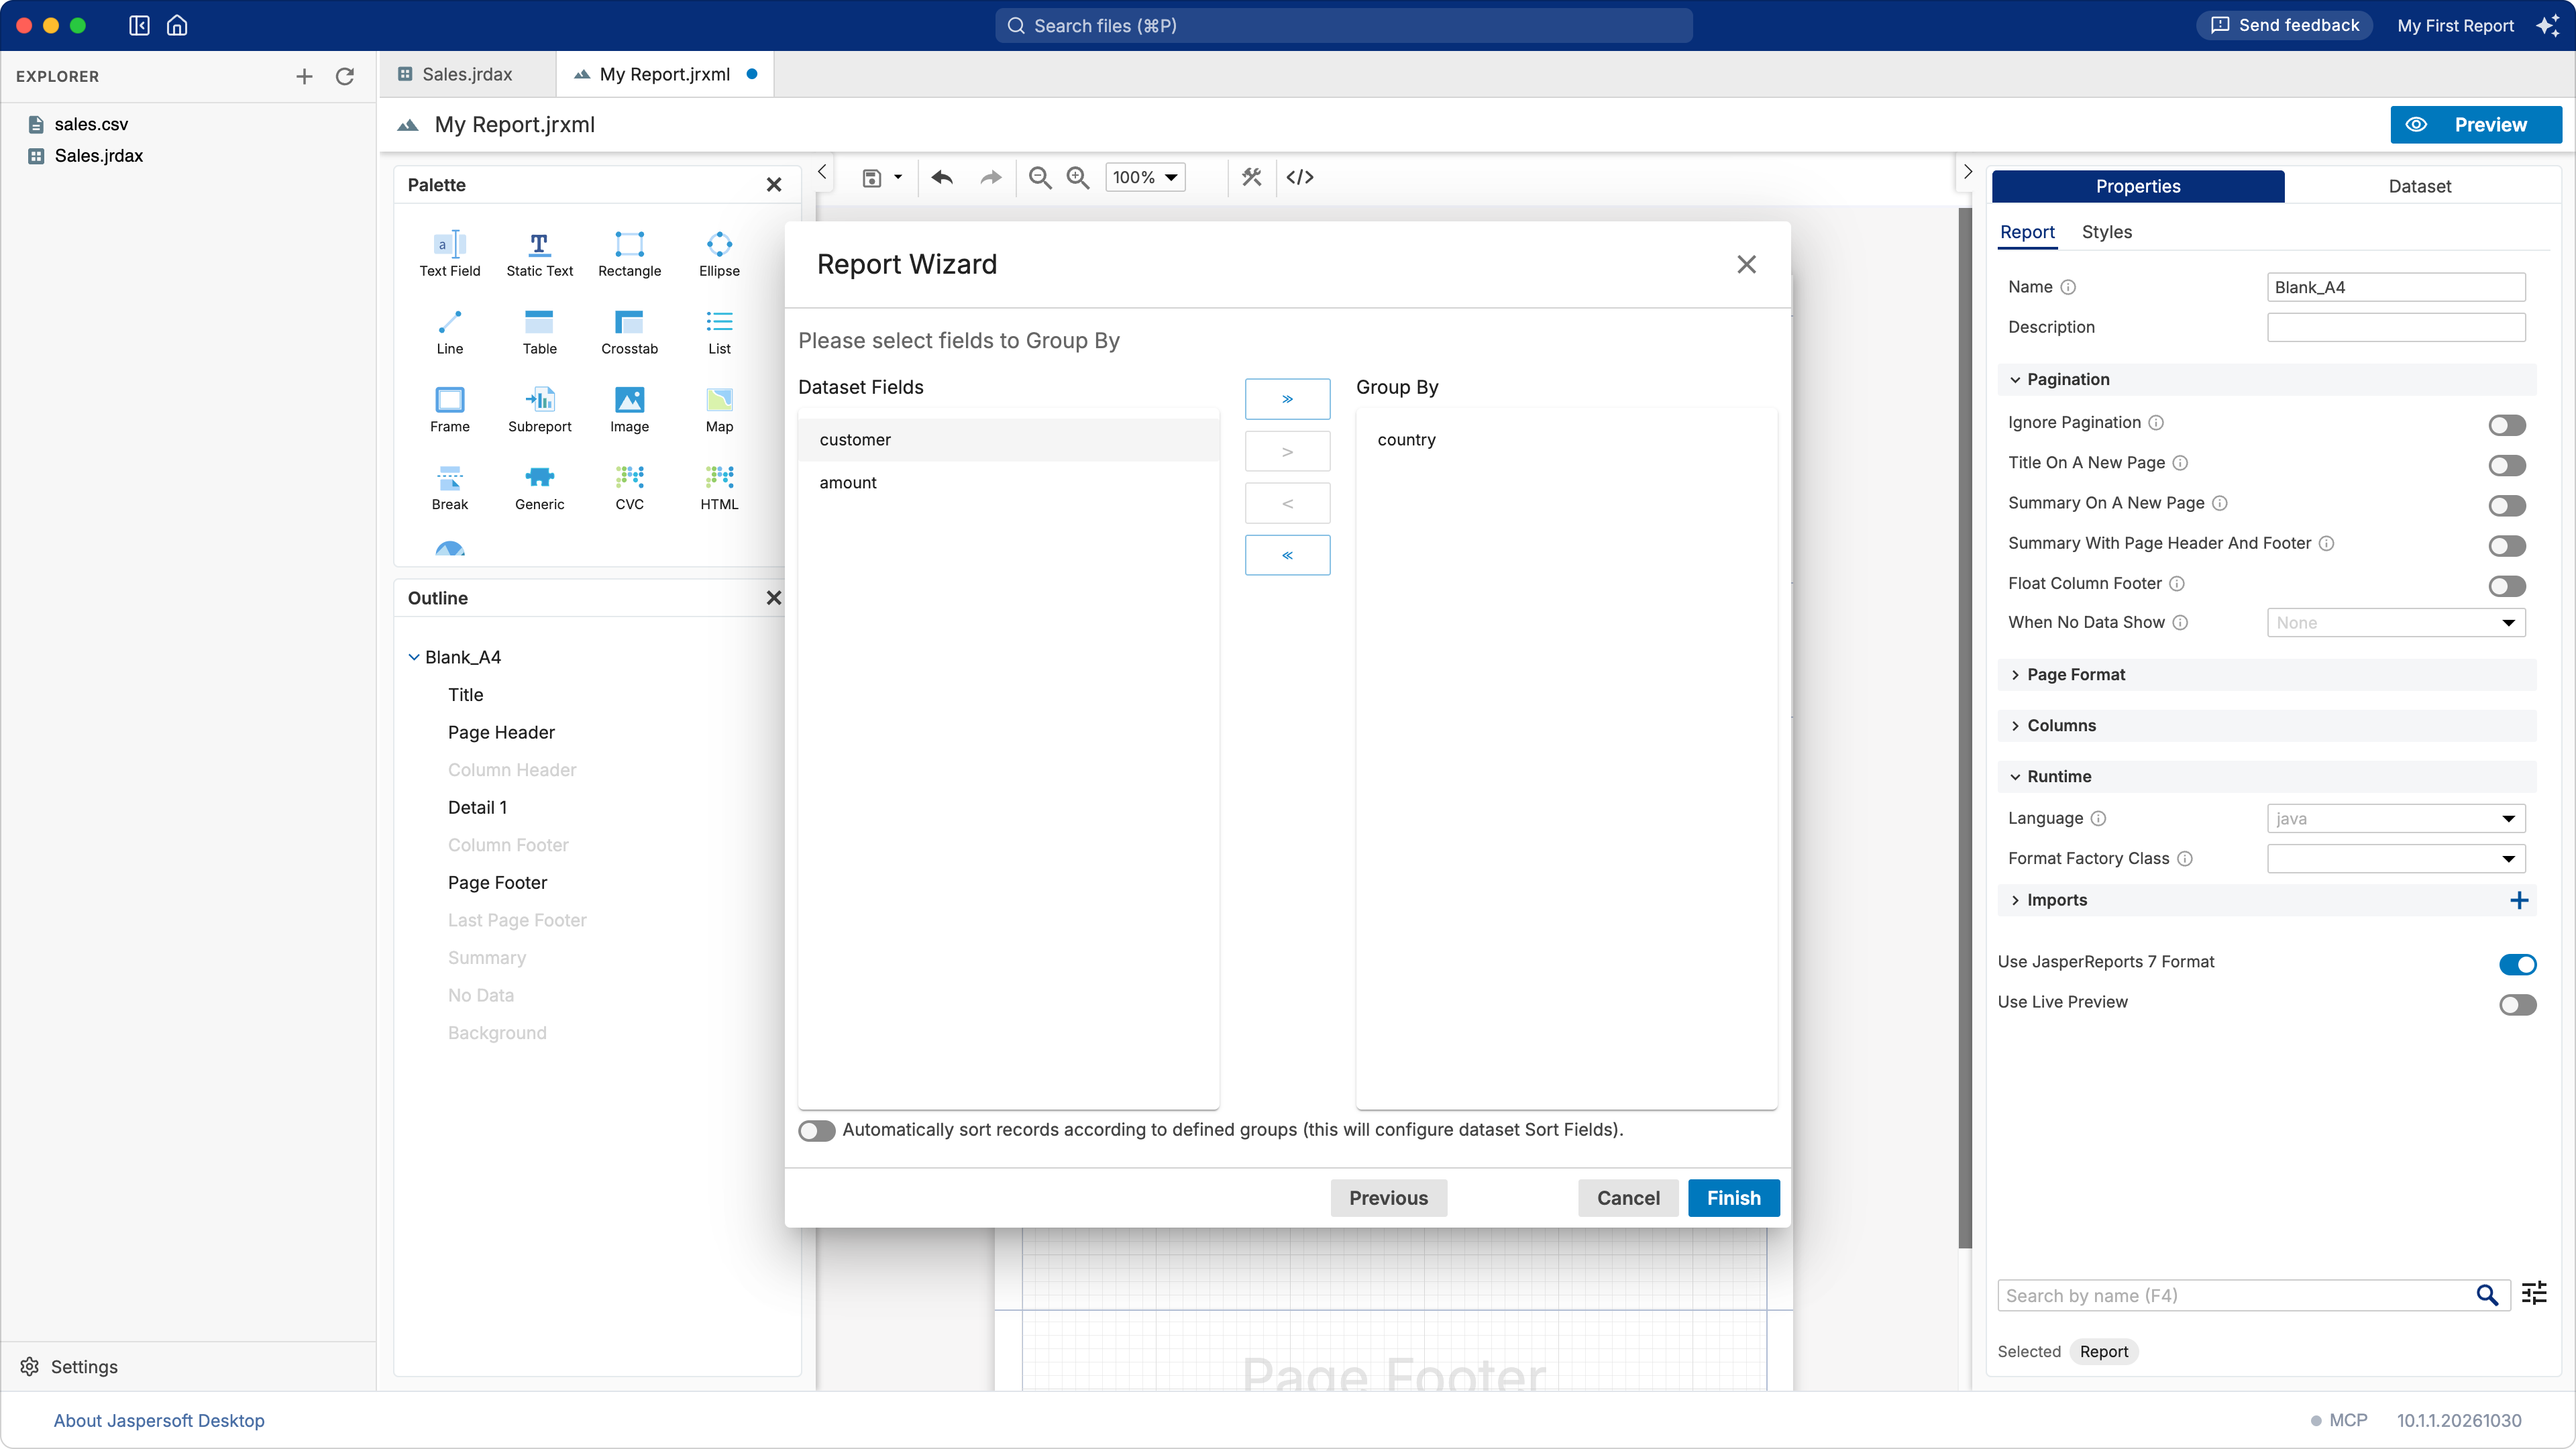
Click Finish. You can click it on any page: the wizard does what you chose so far.
3. Your report in the designer
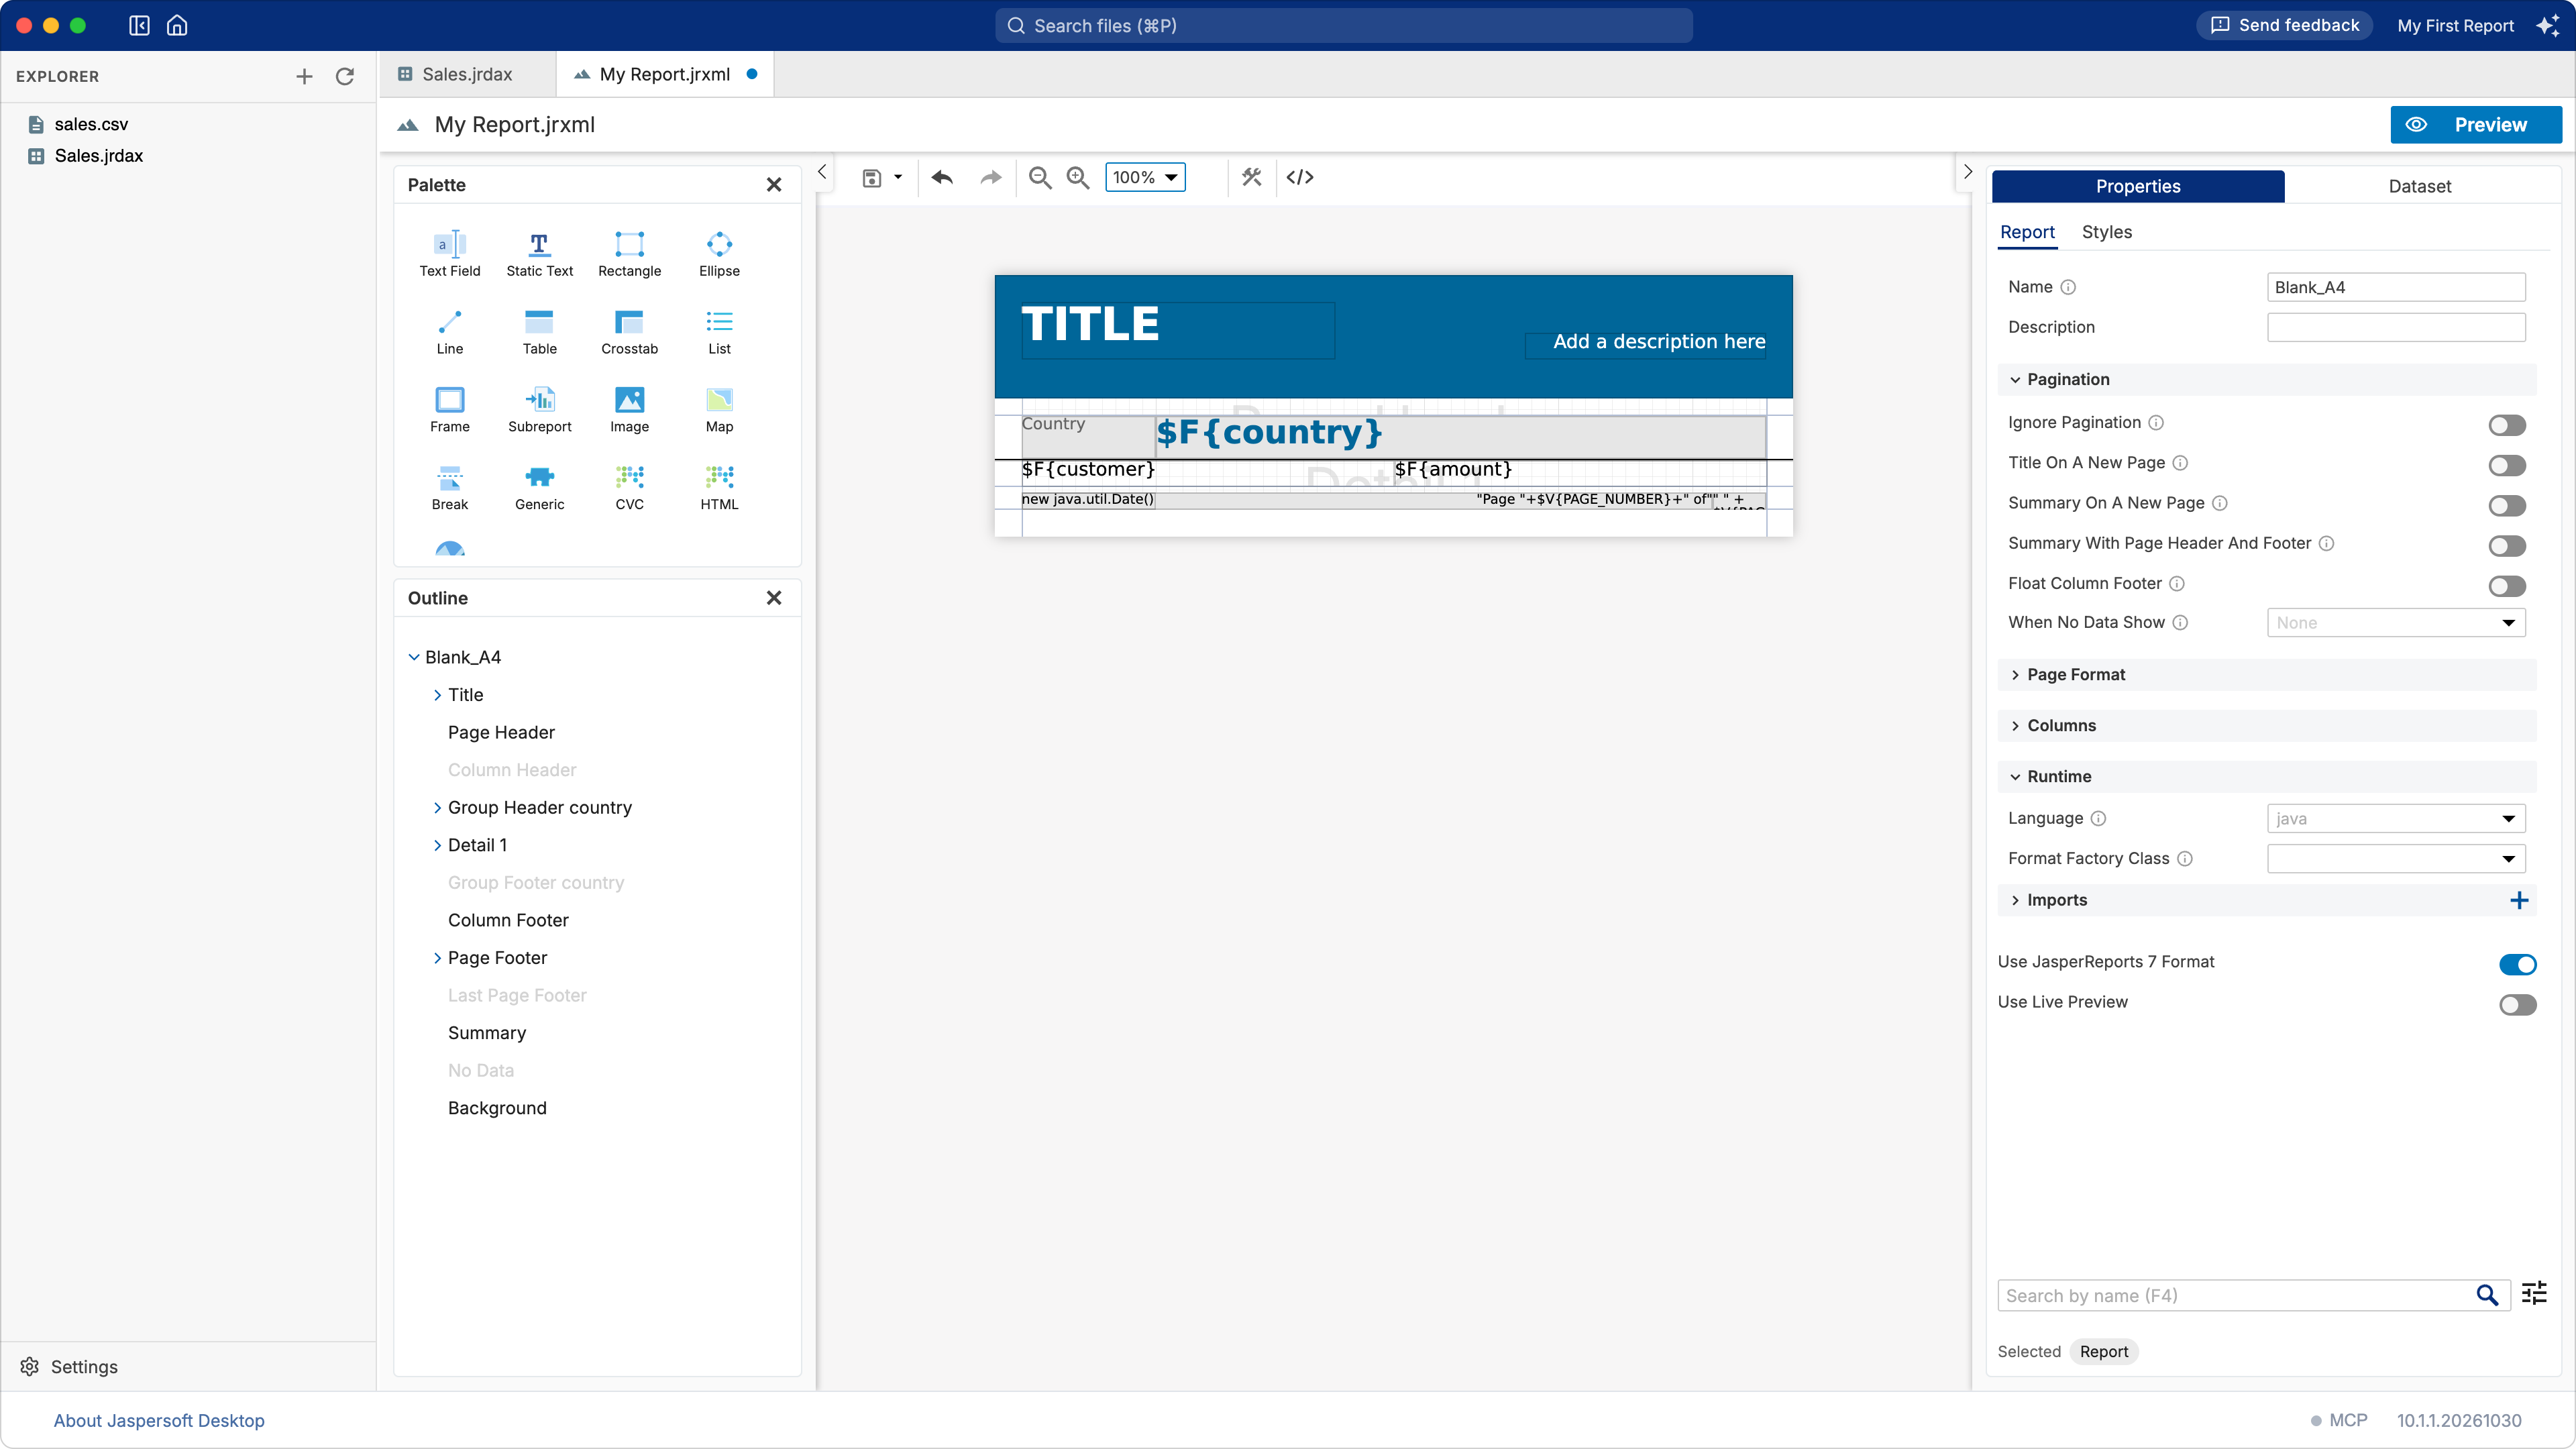
The report designer shows the page of the report divided in bands: the title, the header of
each group, the detail (repeated for each row of data), the page footer. Text in $F{…} is a field
of your data.
| Part | What it is for |
|---|---|
| Palette | Elements to drag onto a band: text, images, charts, tables… |
| Outline | The bands and the elements of the report, as a tree. |
| Properties | The properties of what is selected: the report itself when nothing is. |
| Dataset | Where the data comes from, the fields, parameters, variables and groups. |
The </> button |
The JRXML source of the report. |
The template left placeholders, such as TITLE and Add a description here. Select one and change its text in the Properties panel.
Save the report: the save button of the toolbar, or ⌘S on macOS, Ctrl+S on Windows and
Linux. The first time, you choose its name, for example Sales by Country.jrxml. Jaspersoft Desktop
never saves for you, but keeps copies of your unsaved work (see Saving, and keeping your work
safe).
4. Preview and export
Click Preview at the top right (or View › Preview, ⌘⇧P / Ctrl+Shift+P). The report runs with its data and shows its pages.
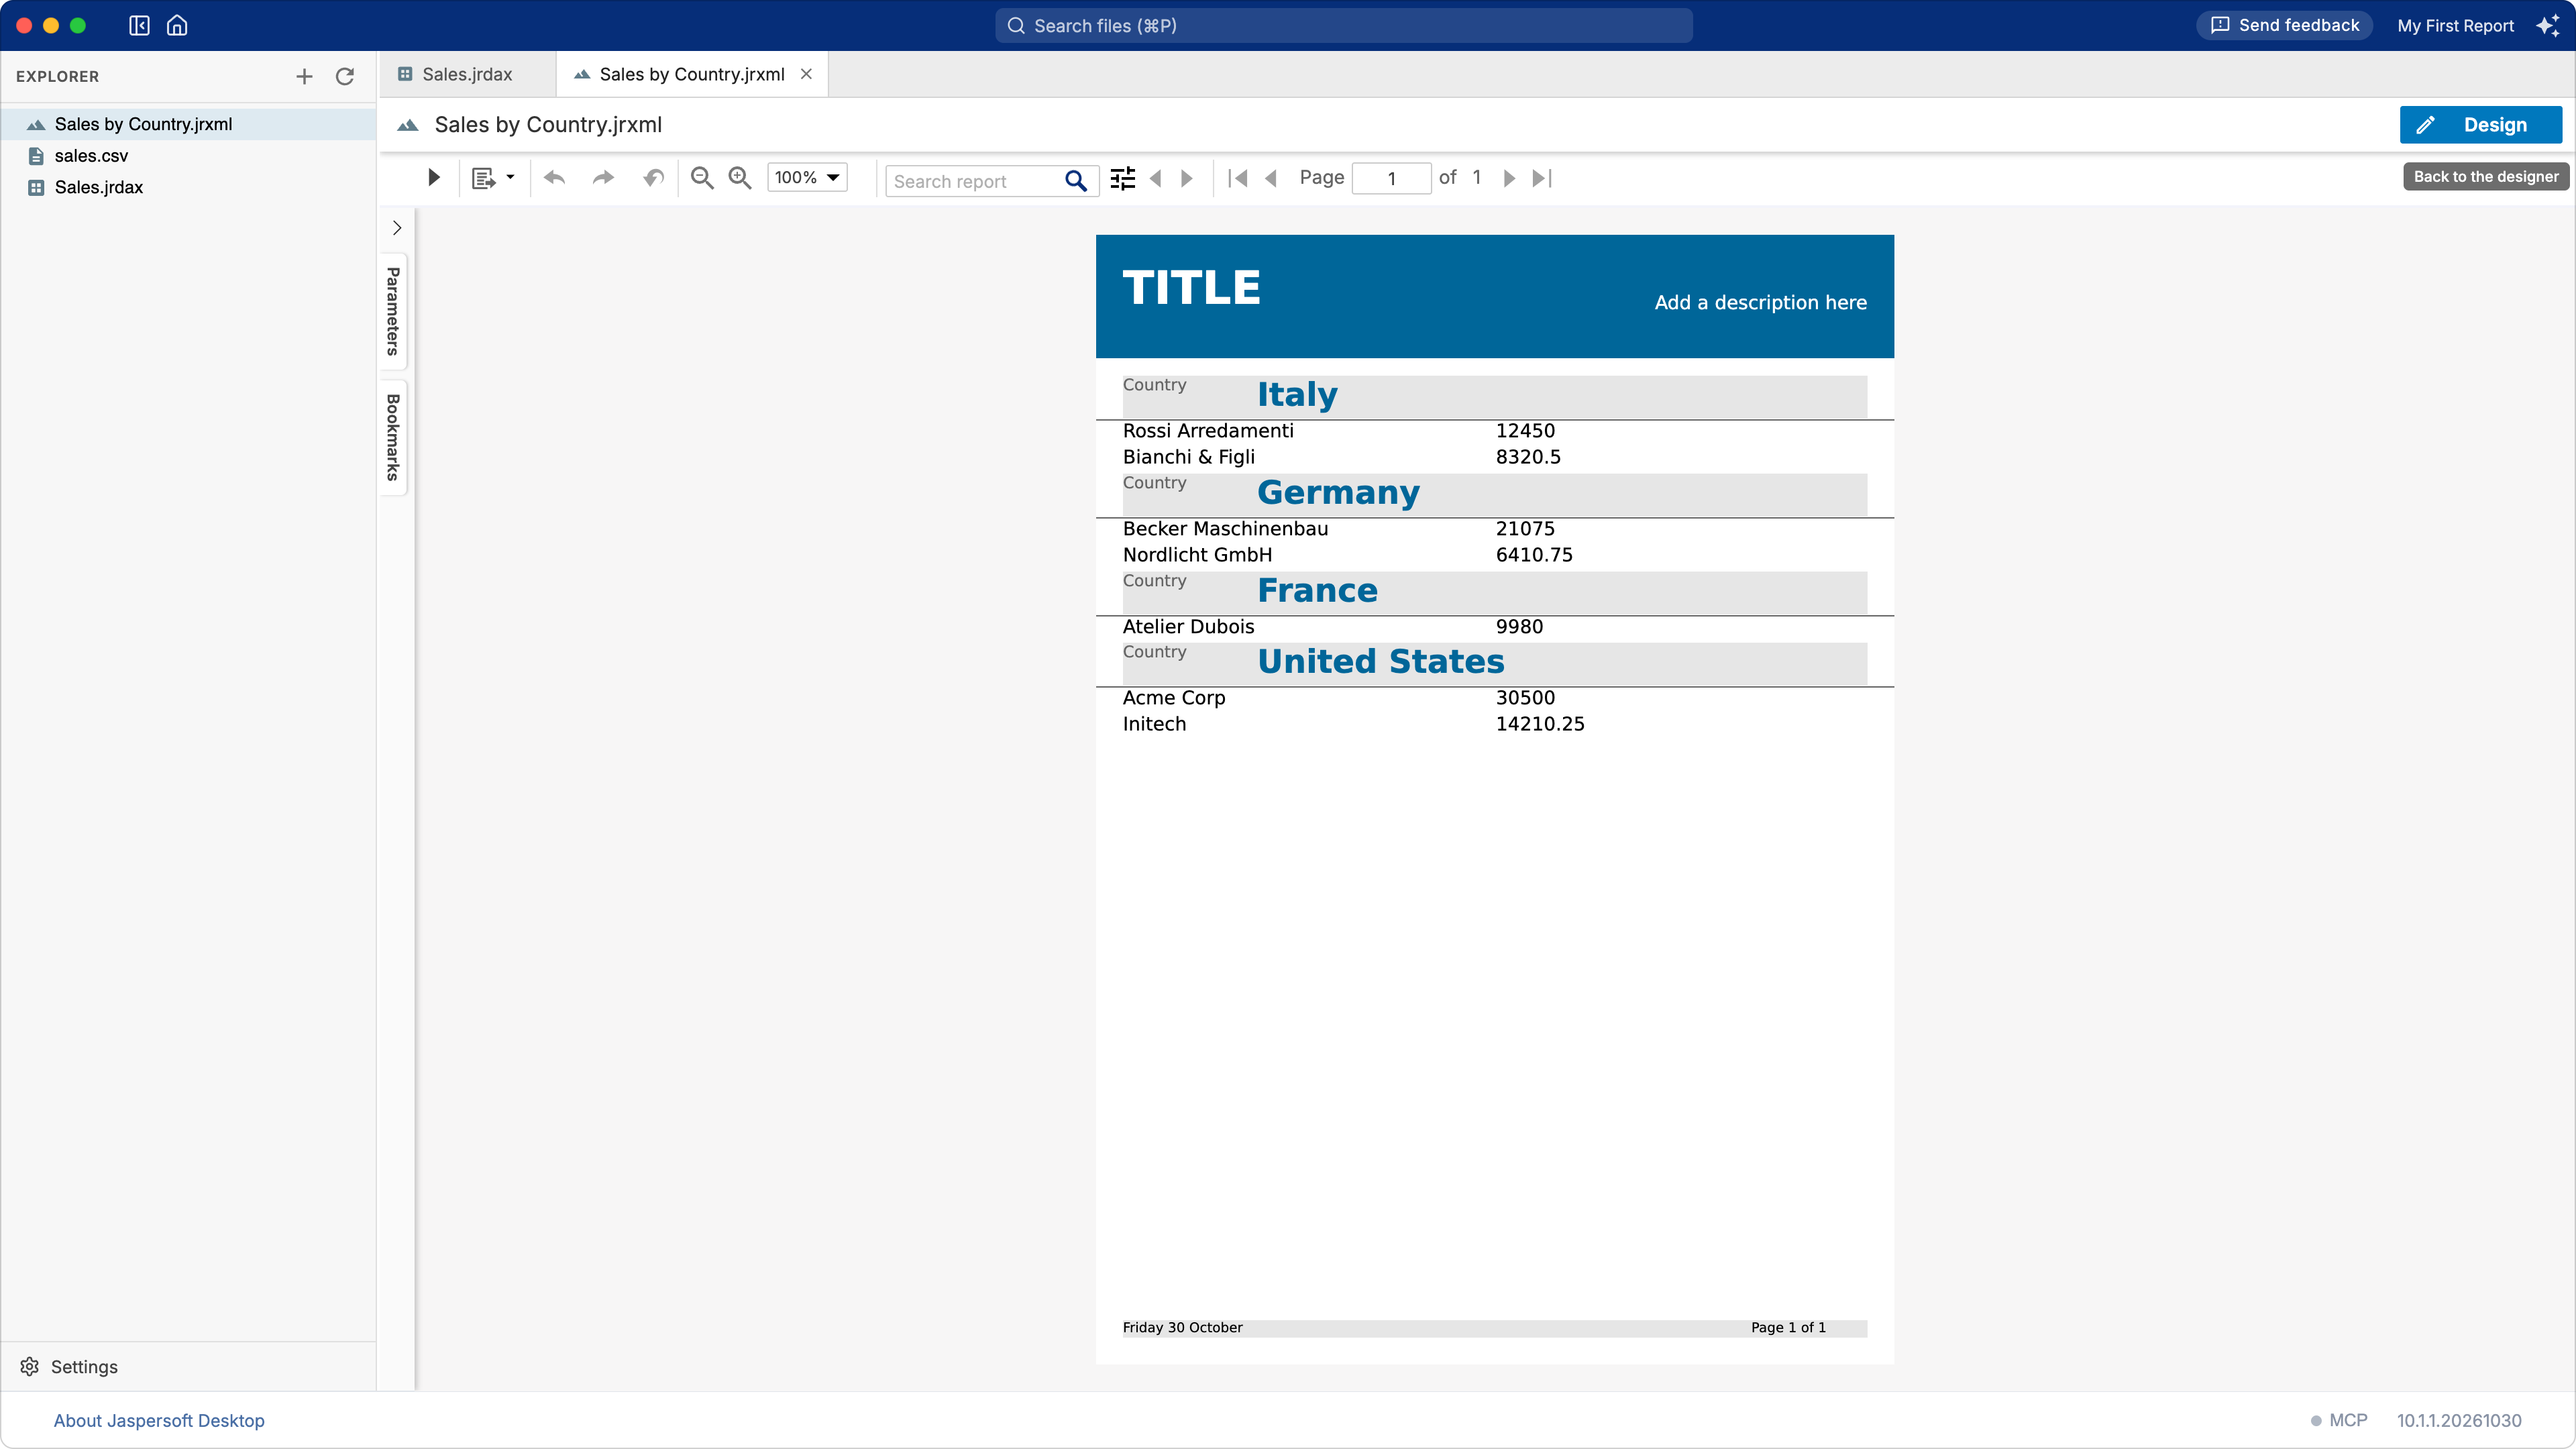
The toolbar of the preview runs the report again, zooms, searches its text and moves between its pages. A report with parameters lists them on the left, under Parameters: change their values and run the report again.
To save the report as a document, open the Export menu, the second button of the toolbar, and choose the format: PDF, Word, Excel, PowerPoint, OpenDocument, RTF or CSV.
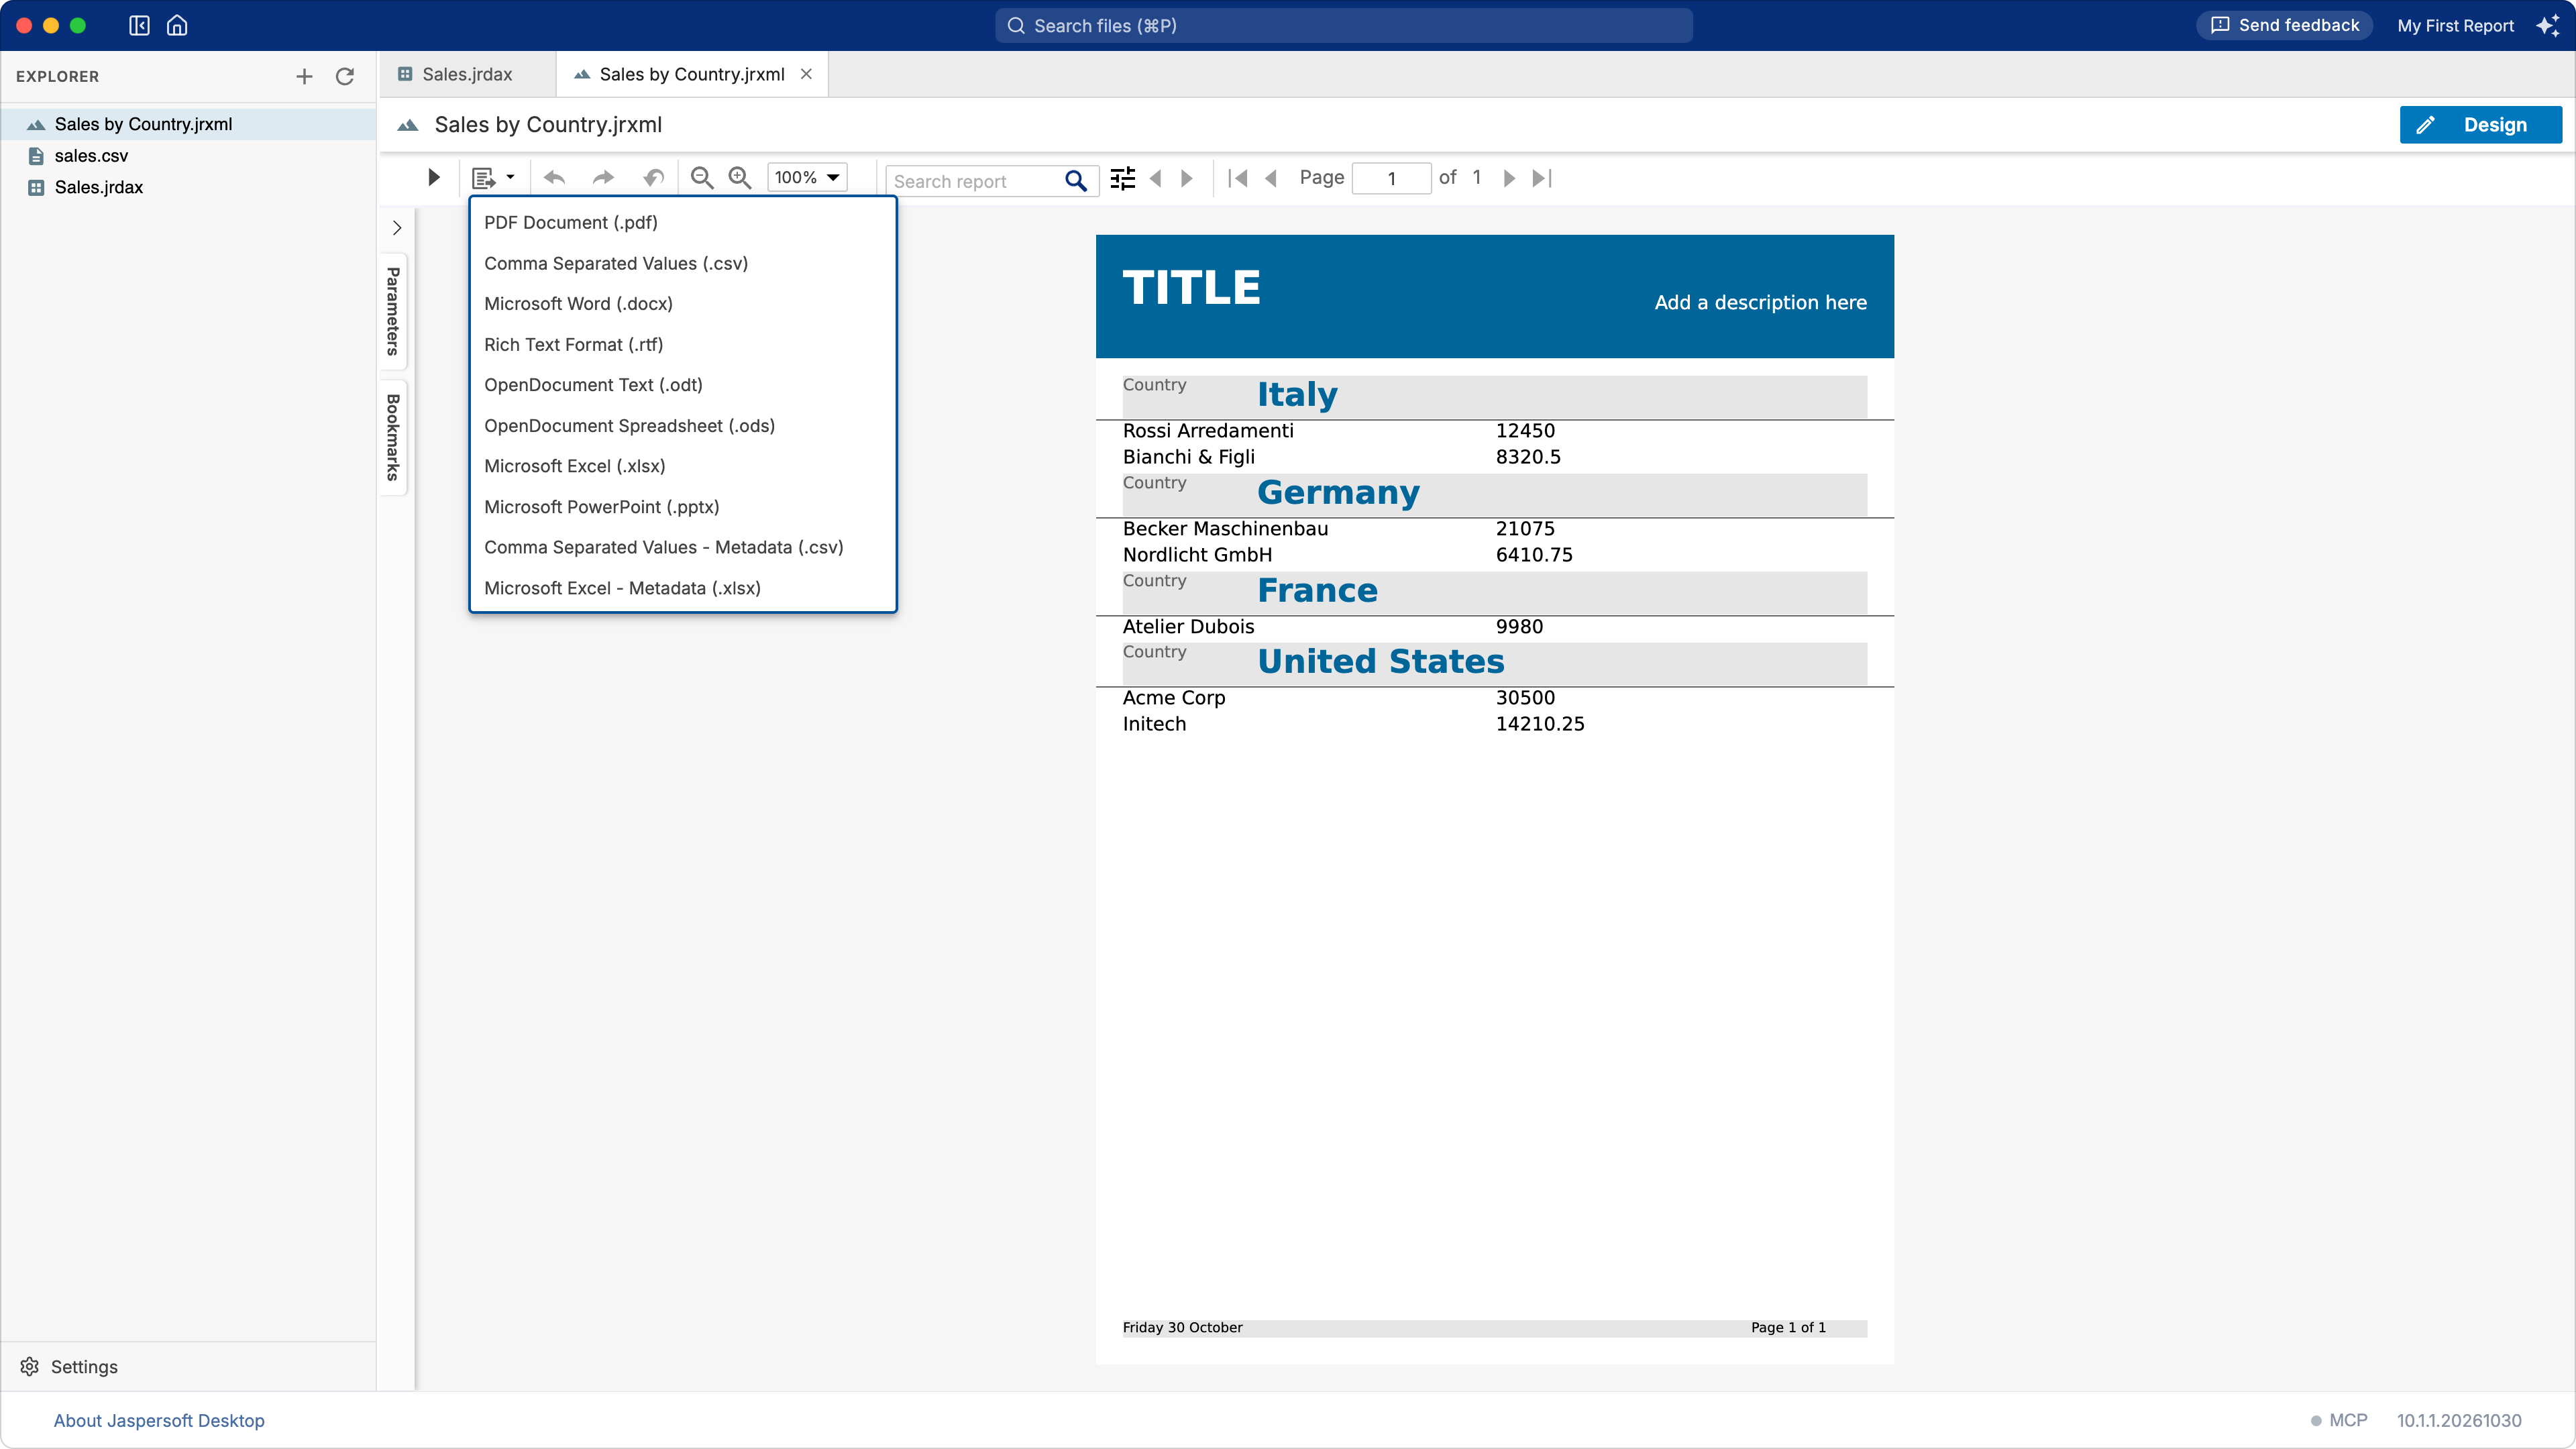
Click Design to go back to the designer.
What next
- Change the look: select an element and change its font, colors and borders in Properties.
- Add a total: drag a Text Field to the summary band, or ask the AI assistant to do it (see Designing reports with AI).
- Use another kind of data, a database for example: see Working with data adapters.