The Report Viewer and Conditional Text
The interactive Report Viewer lets you highlight table values using conditional formatting. This section shows how to use multiple conditions in a table to create a stoplight format based on ranges. To set up this format, you need to use the inheritance feature of conditional formatting. For colored backgrounds, this specifies that when a table cell satisfies multiple conditions, the condition that appears highest in the list of conditions is applied.
To create the Ad Hoc table for use in the example
-
Select Create > Ad Hoc View from the menu. The Data Chooser wizard opens.
-
Click Domains, select SuperMart Domain, and click Choose Data. The Data Chooser opens to the Select Fields page.
-
In the Source panel, double-click Sales to move it to the Selected Fields panel and click OK. The Ad Hoc Editor is displayed with the selected fields.
-
Click
 . The Select Visualization Type window appears.
 -
Select
 and click X in the upper corner of the window to create a table.
 -
Double-click the following fields and measures to add them to the Columns area: Product Name, Recyclable Packaging, Store Sales. The Ad Hoc view appears as shown in the following figure.
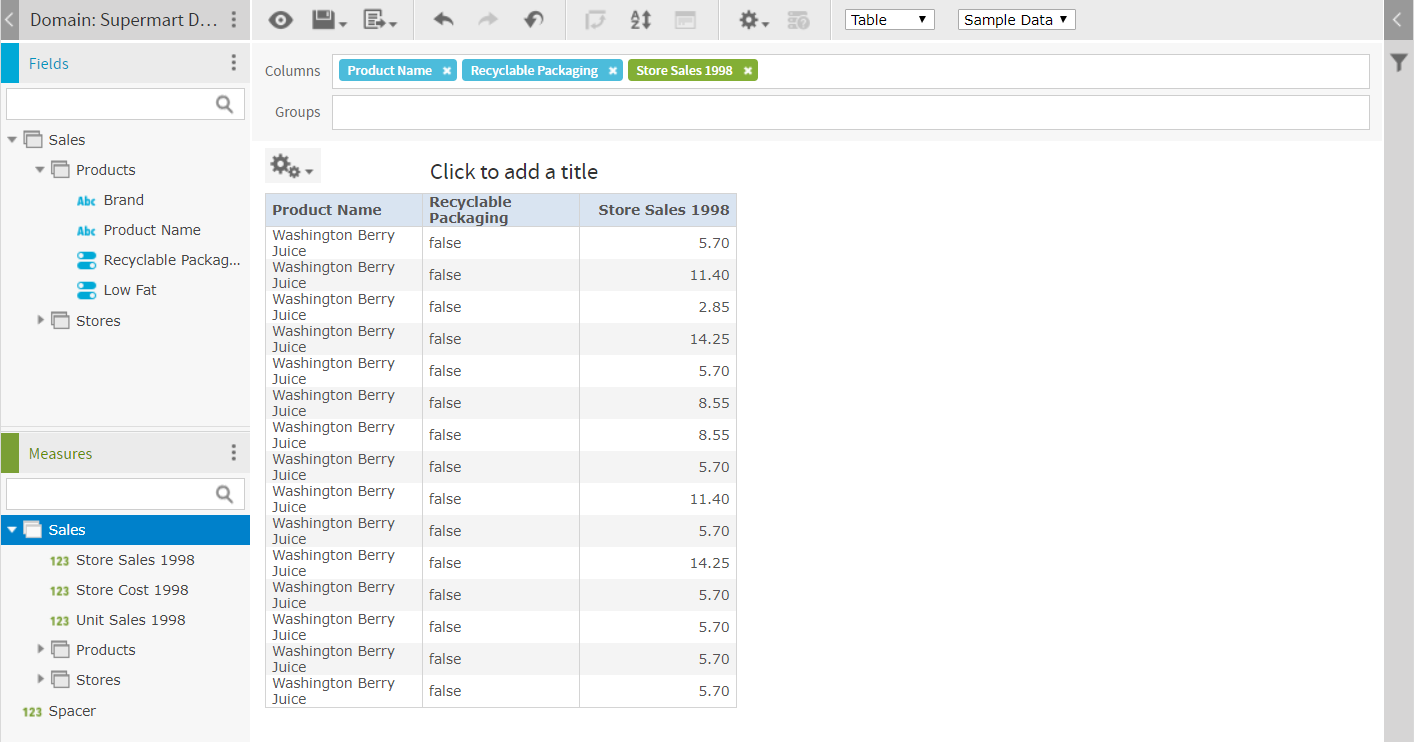
Figure 1 Ad Hoc View for Conditional Text
-
Hover over
 and select Save Ad Hoc View and Create Report. The Save Ad Hoc View dialog opens.
 -
Fill in the required fields as follows:
- Data View Name: Conditional Text Example View
- Data View Description: Created in Ultimate Guide
- Report Name: Conditional Text Example Report
- Report Description: Created in Ultimate Guide
-
For Save Location, click Browse, select Public > Samples > Reports, and click OK.
-
Click Save. A message confirms that the view was saved.
To open the report in the viewer
- Select View > Repository.
- Navigate to Public > Samples > Reports and click Conditional Text Example Report. The report opens in the interactive report viewer.
To create “stop light” conditional formatting on a numeric column
-
Click the Store Sales column. The column is highlighted and the column formatting icons appear at the top of the column.
-
Move your mouse over
 and select Formatting... The Format Columns dialog box appears.
 -
Click the Conditional Formatting tab. The Conditional Formatting options appear.
-
Click Add to create a new condition, and fill in the fields as follows:
- Select Greater than from the Operator menu.
- Enter 8 in the Condition box.
- Click
 and pick a green background.
-
Click Add to create a second condition, and fill in the fields as follows:
- Select Greater than from the Operator menu.
- Enter 3.5 in the Condition box.
- Click and pick a yellow background.
-
Click Add to create a new condition, and fill in the fields as follows:
-
Select Less than or equal to from the Operator menu.
-
Enter 3.5 in the Condition box.
-
Click
and pick a red background.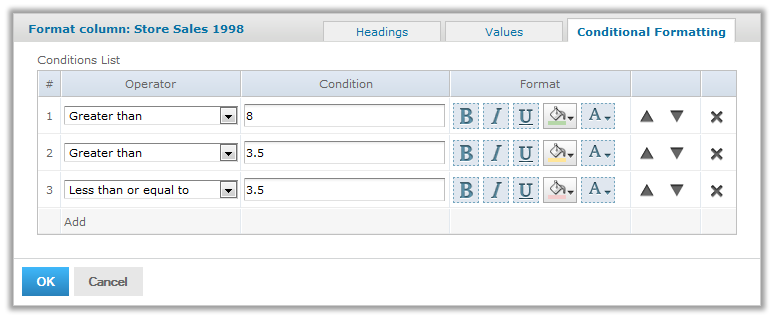
Figure 2 Conditional Formatting for Numeric Values
-
-
Click OK. The dialog box closes and your choices are applied. The report appears as shown in the following figure:
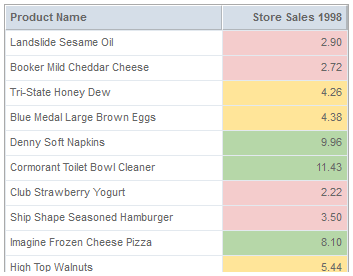
Figure 3 Report with Conditional Formatting
Notice that numbers greater than 8 satisfy the first two conditions; the first condition they satisfy is the one that is applied.