Viewing and Analyzing Traces
The section describes the process of searching, sorting, and reading traces of logs in the Jaeger UI. Consider an example of the rest_v2/jobs API service, which gets triggered to create a scheduled report execution. The below section includes steps to search, sort, and read traces of Scheduler for the rest_v2/jobs API service.
Viewing and Reading Traces
The following figure shows various attributes of spans in the Jaeger UI.
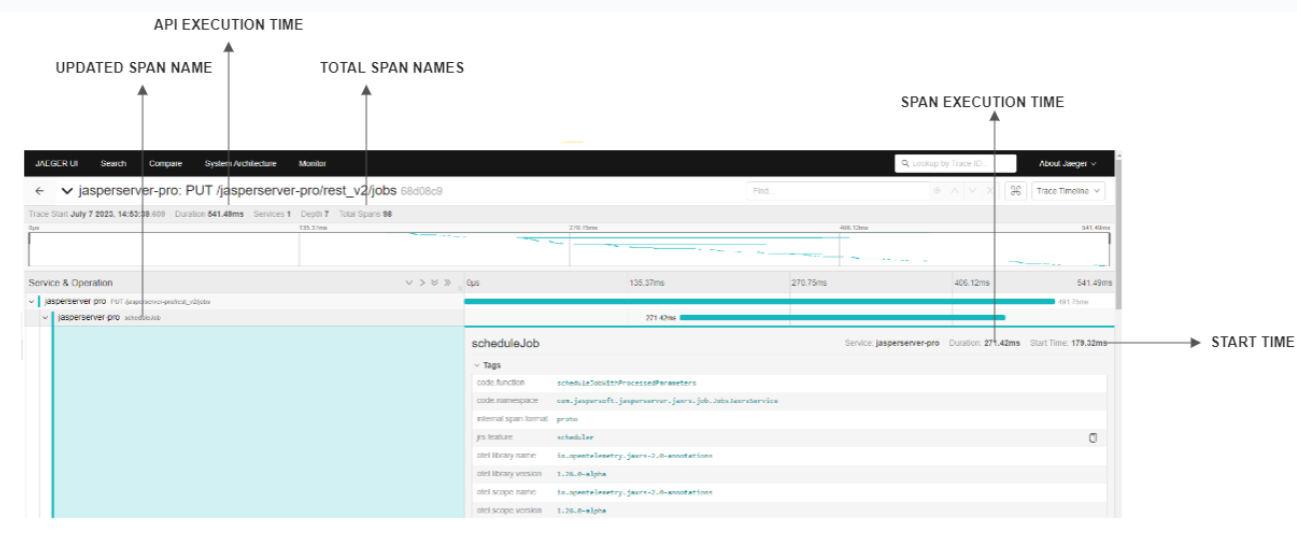
Figure 1 Viewing Spans on Jaeger
Example of Viewing traces of Report Scheduling
To search and read traces of the scheduled report in Jaeger UI, do the following:
-
Login to JasperReports Server and create a schedule (For more information, see JasperReports Server User Guide).
-
Login to Jaeger UI using
http://<hostname>:16686. -
Choose the
scheduleJobAPImethod name in operation. This method is responsible for scheduling a report. -
Click
Find Traces.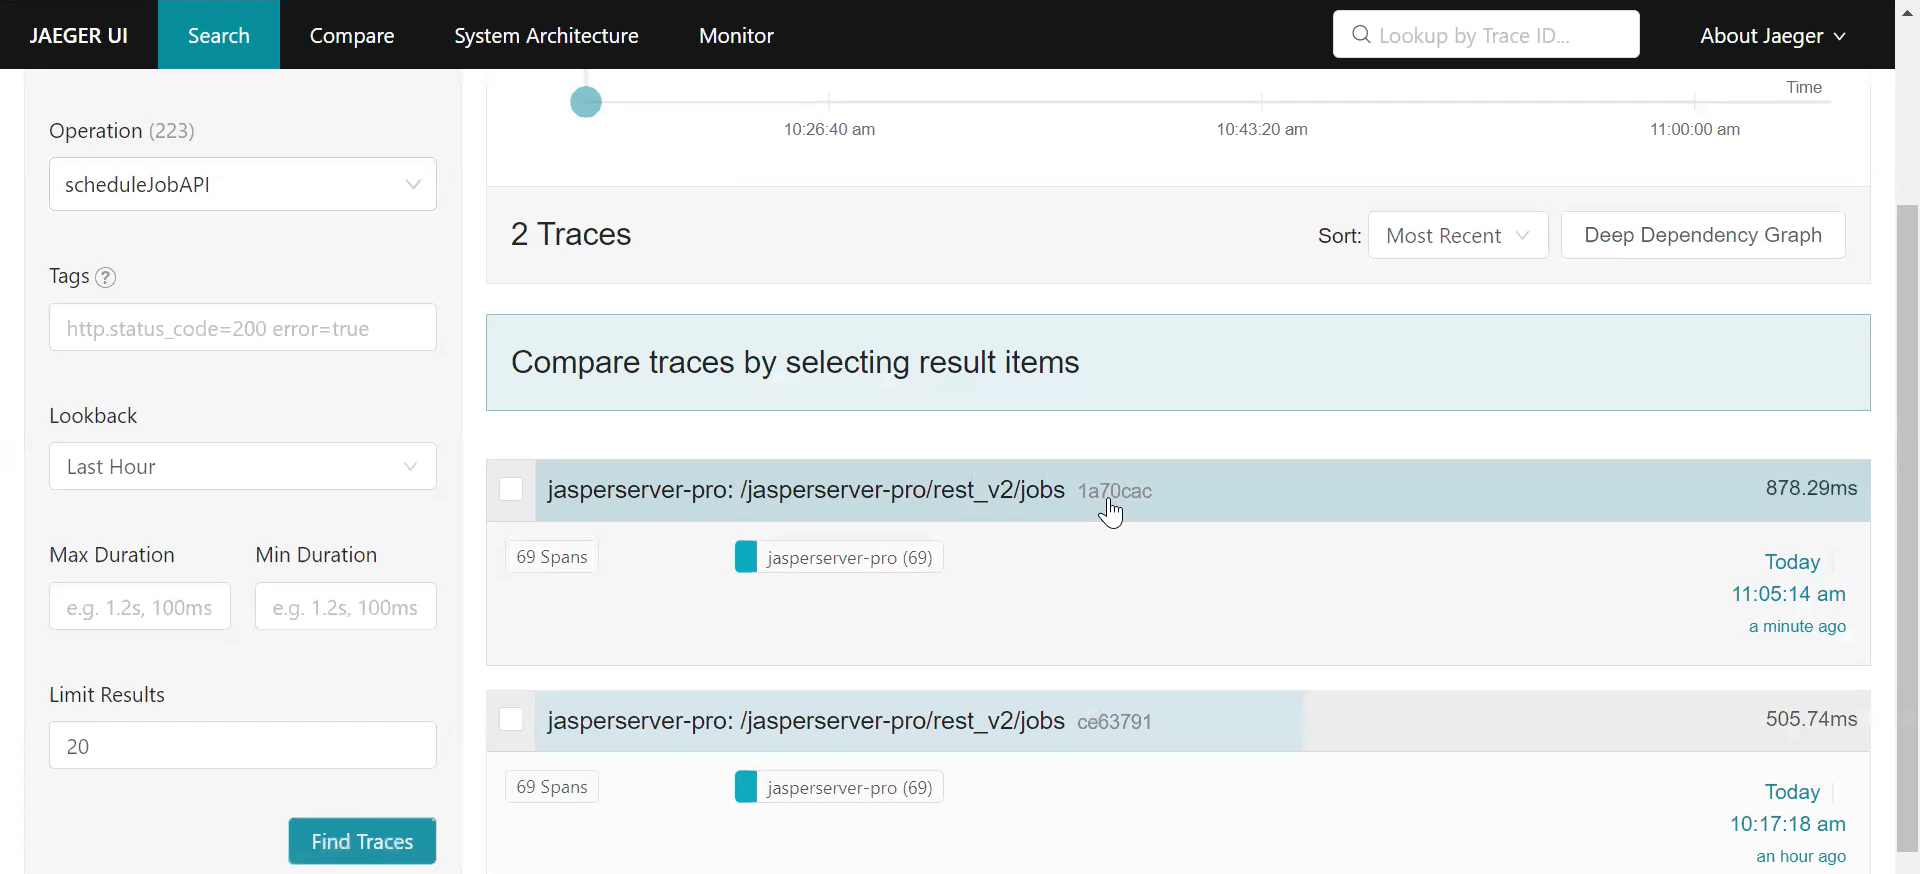
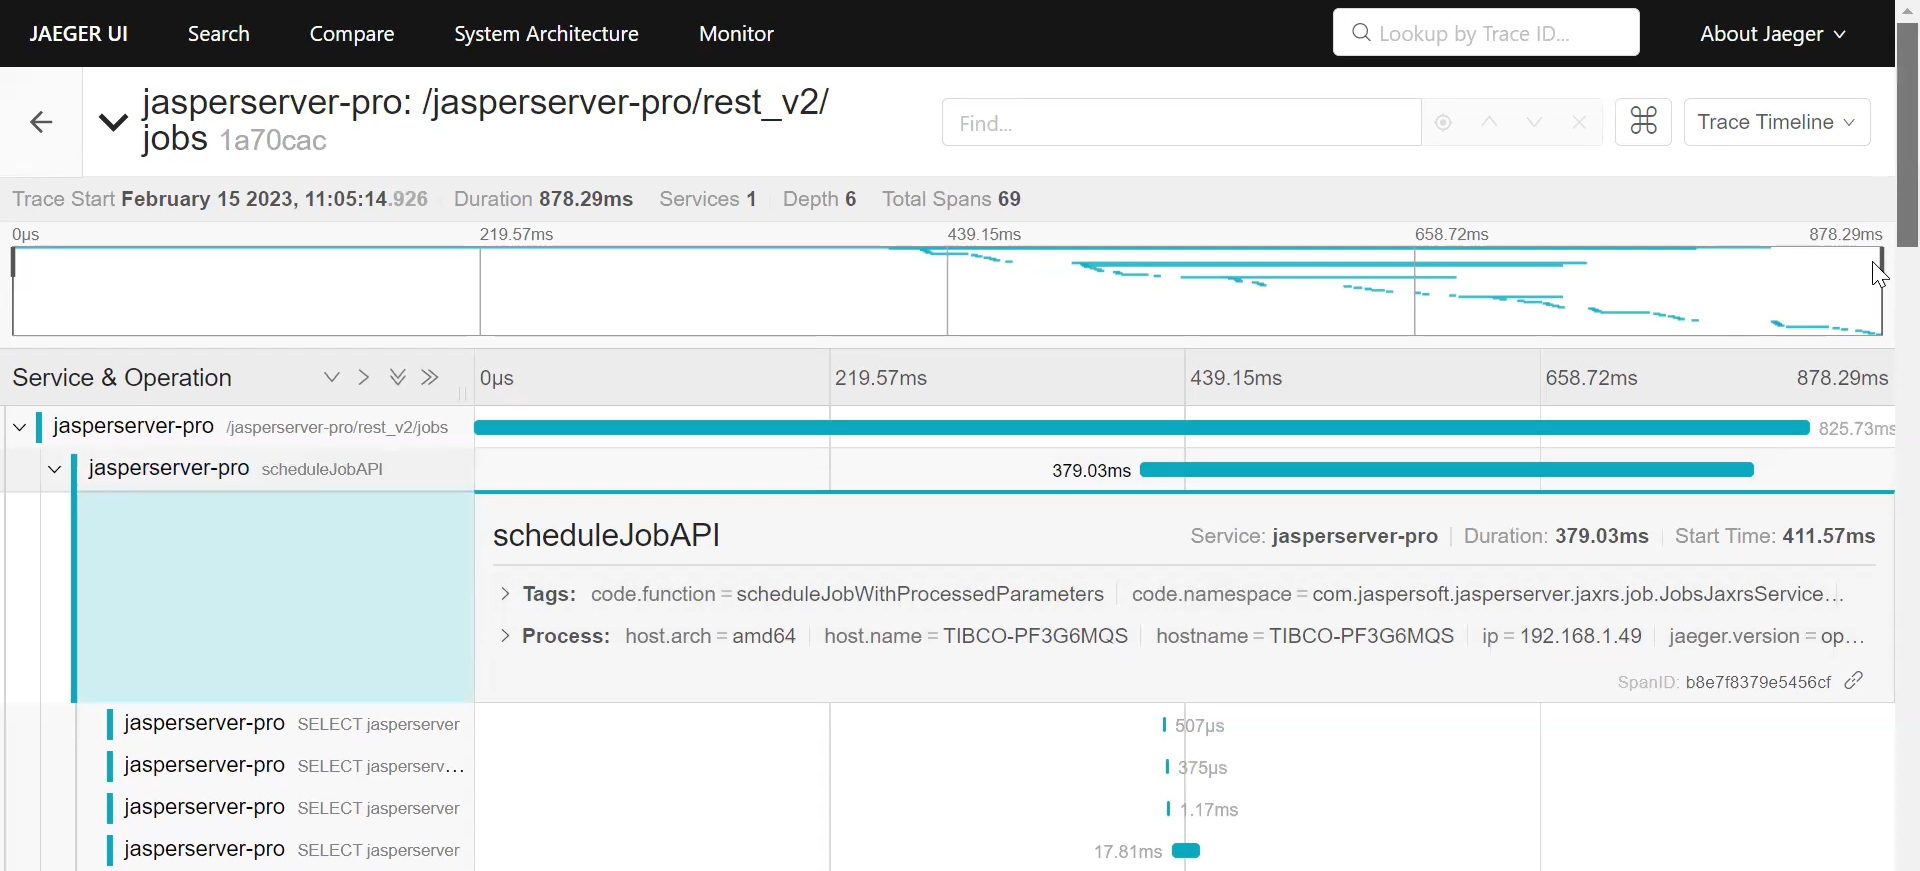
Figure 2 Viewing Traces of Report Scheduling
-
Choose from any result items to view traces of
rest_v2/jobs.
For filtering and viewing only Scheduler methods you can search jrs.feature="scheduler" in the tags. This filters out the span names of only Scheduler methods and displays them in the Jaeger UI.
The following figure shows the traces of report job and scheduler. Choose any trace and then click Tags, to see which tag was added for filtering Scheduler traces.
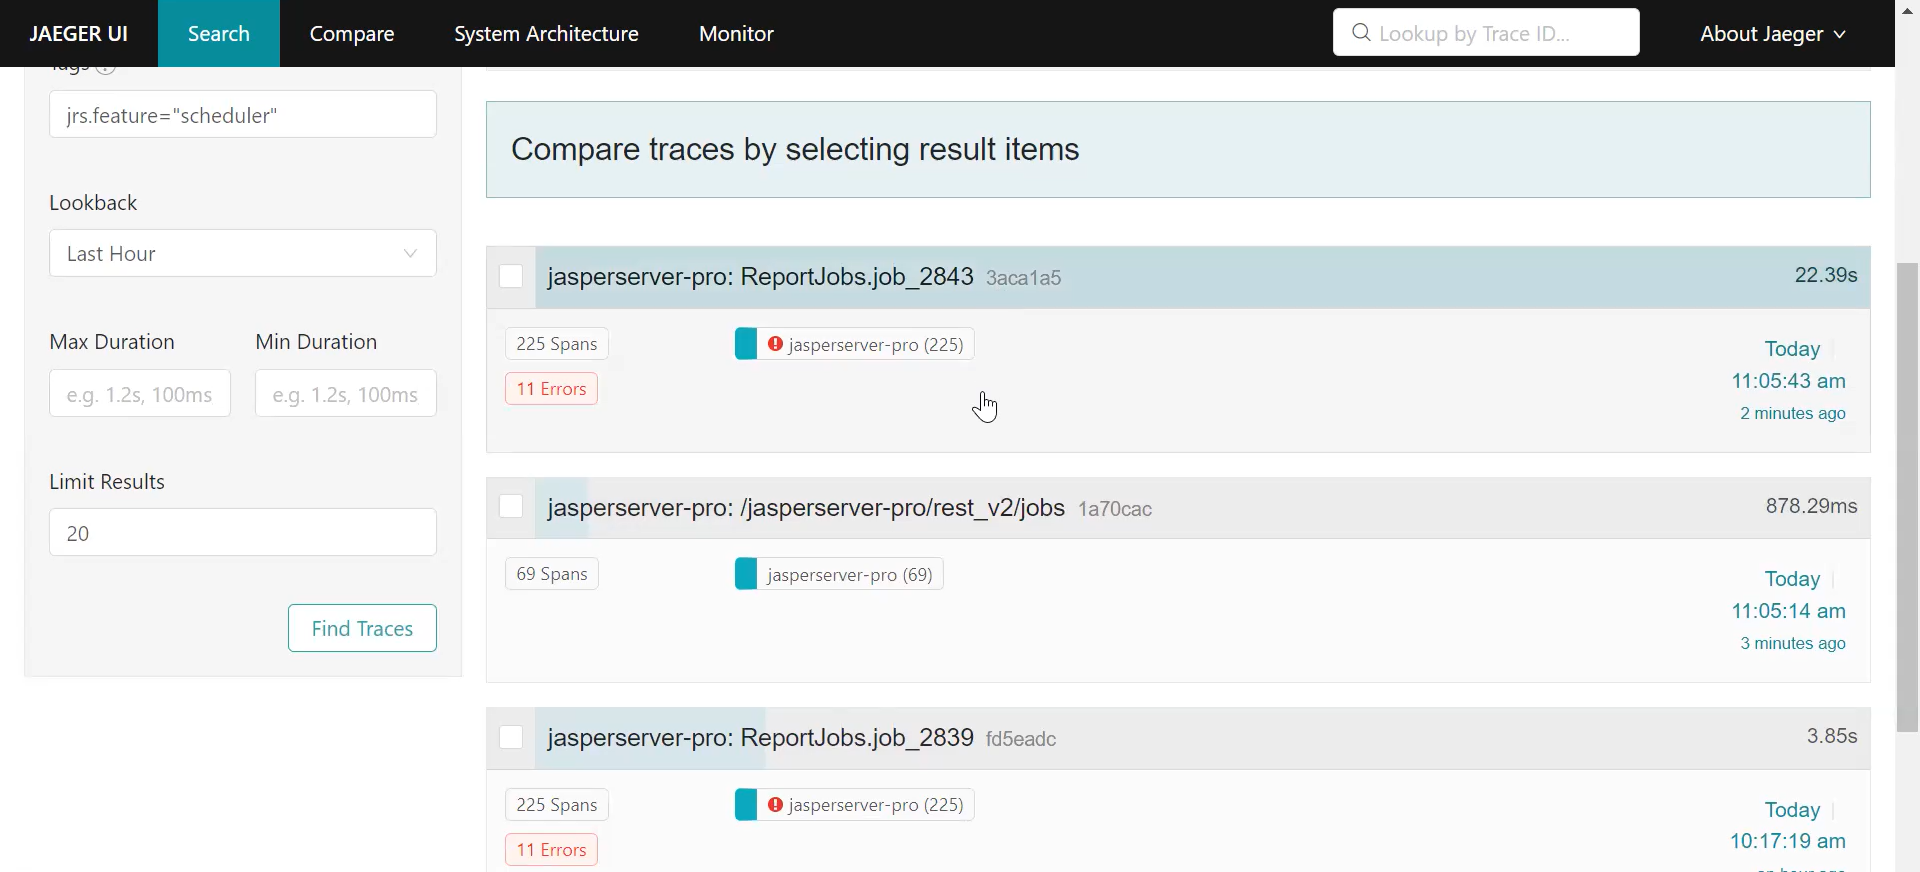
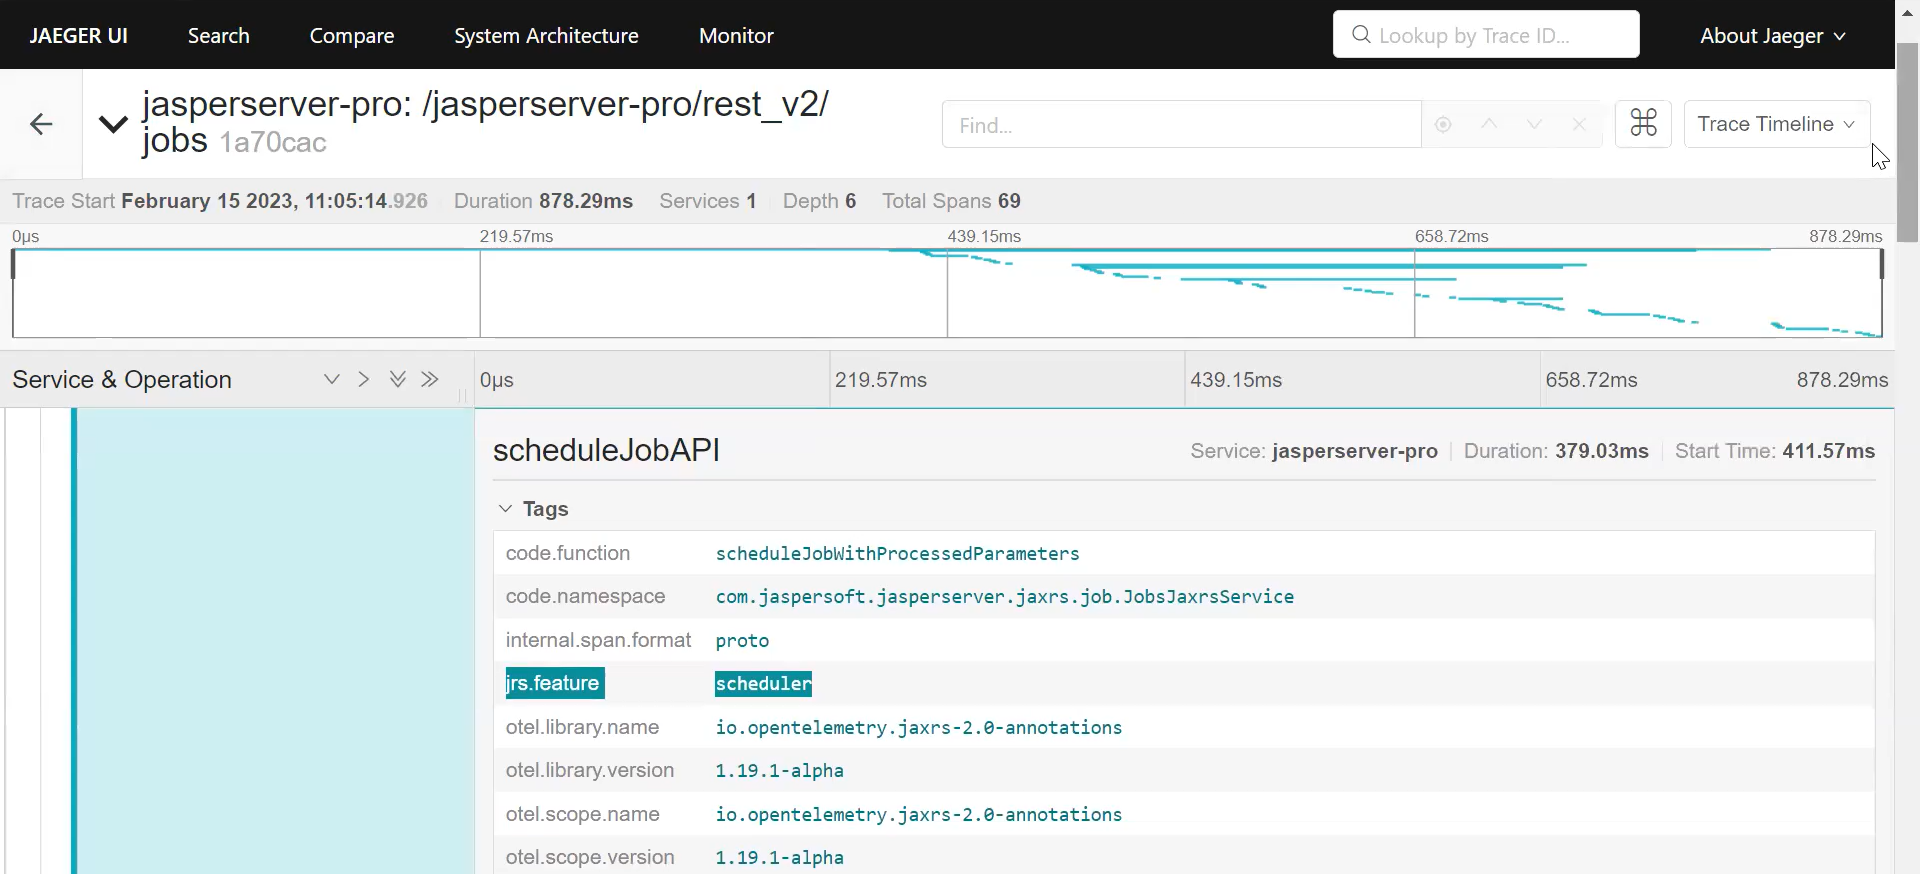
Figure 3 Filtering Traces of the Scheduler
Example of Viewing traces of Report Execution
To search and read traces of report execution in Jaeger UI, do the following:
-
Login to JasperReports Server and create a schedule (For more information, see JasperReports Server User Guide).
-
Login to Jaeger UI using
http://<hostname>:16686. -
Choose the
executeReportmethod name in operation. This method is responsible for executing a report. -
Click
Find Traces.
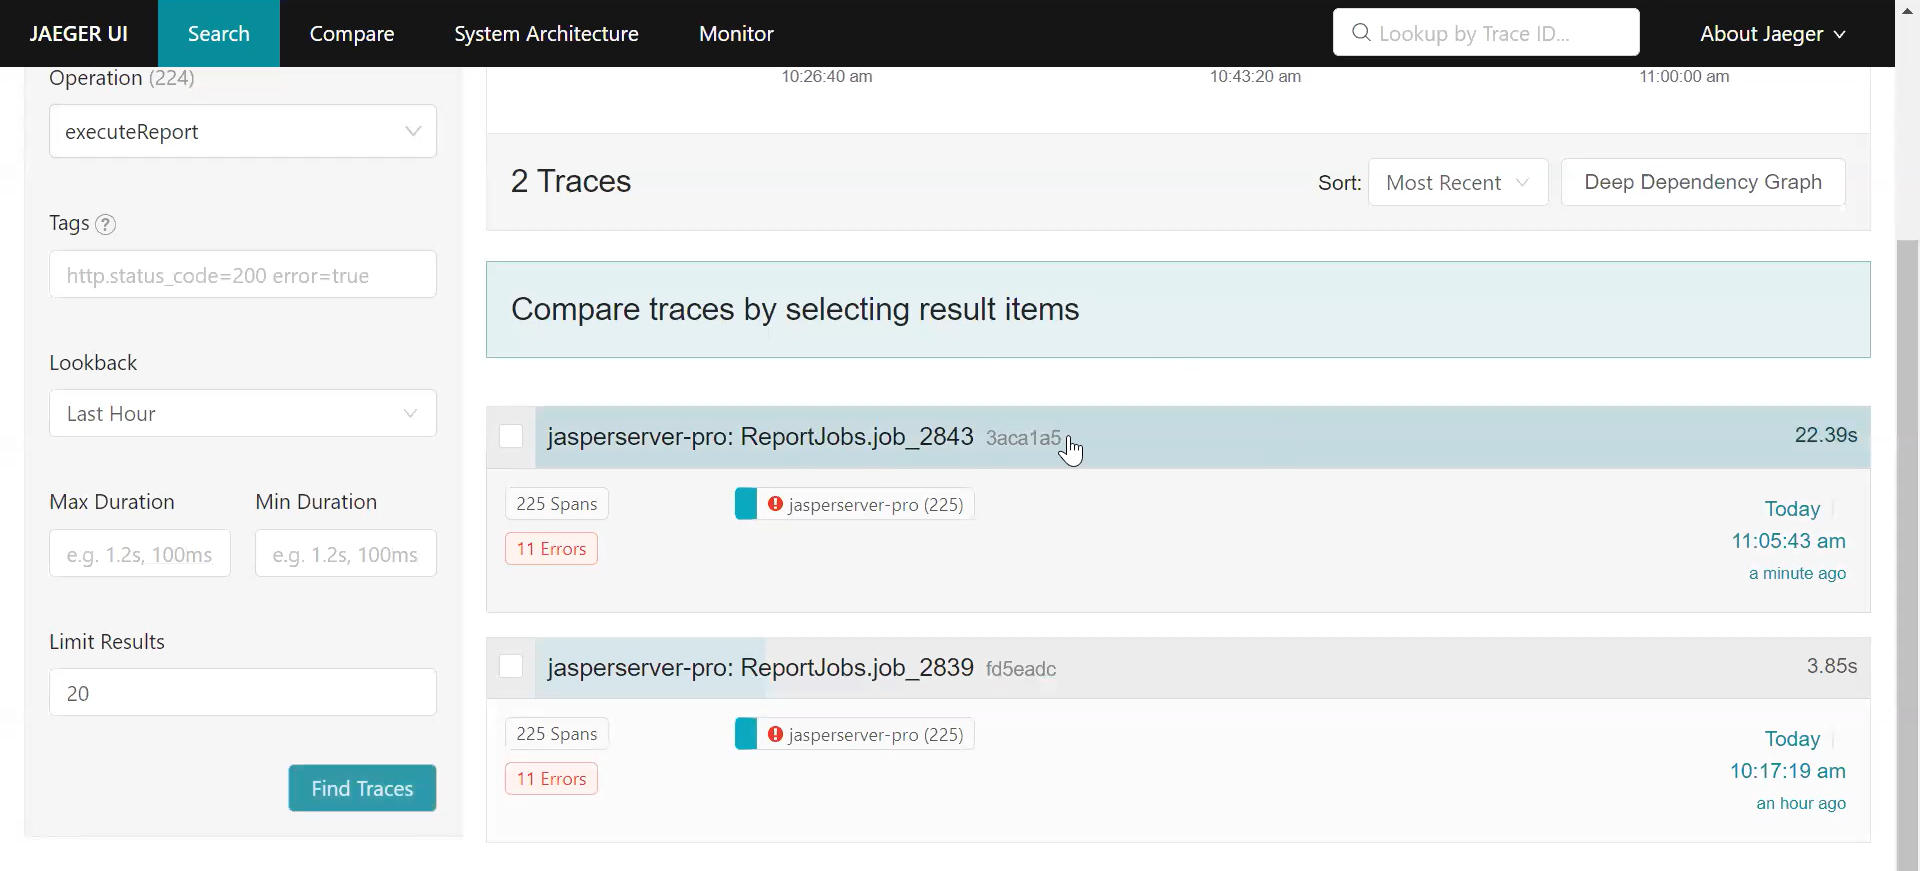
Figure 4 Viewing Traces of Report Execution
Suppressing Span
Suppression of unwanted spans is required to remove the unnecessary database calls, which gets added in traces. While viewing traces in Jaeger, we observed unnecessary database calls, which resulted in increasing the span number within the trace.
You need to suppress the spans to remove the unwanted hibernate spans that are not required to view only relevant spans. For suppressing span, instrument the span by setting export OTEL_INSTRUMENTATION_HIBERNATE_ENABLED=false in tomcat/bin.