Chart Customizers
Chart customizers are Java classes that change the appearance of charts. Chart customizers let you implement JFreeChart functionality that has not been directly included in JasperReports. For example, you can use chart customizer classes to change the shape of the legend icons in a chart or change the colors or pattern of the bars in a bar chart.
Jaspersoft Studio provides a simple UI for applying chart customizers. This includes a number of out-of-the-box customizers for common configurations as well as a mechanism to let you add your own customizers to the UI. In addition, if you create a configurable customizer, that is, a customizer that lets the user set values in the report rather than hard-coding them, you can create a user interface for it using a JSON file.
Using Chart Customizers
Adding a Chart Customizer to a Chart
To apply an existing customizer to a chart:
-
Select your chart in Design view.
-
On the Chart tab of the Properties view, click Add next to the Chart Customizers section.
The Select the newChart Customizer dialog is displayed. By default, only chart customizers that support your current chart type are shown.
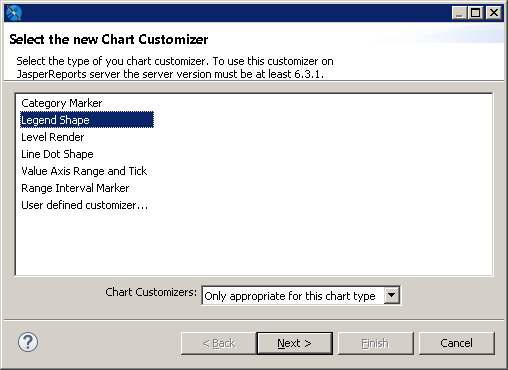
Figure 1 Chart customizer selection dialog -
Select a chart customizer from the list.
If the customizer is configurable and has a user interface, the Next button is available. Otherwise, the Finish button is available.
-
Click Next if it is available.
The user interface for the customizer is displayed. For example, the interface for Legend Shape is shown below.
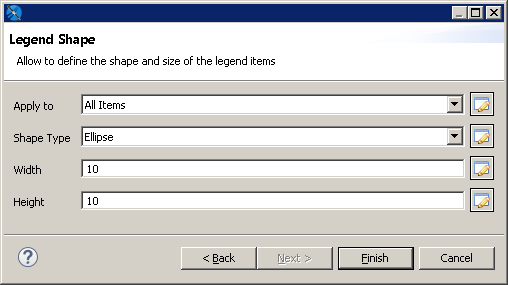
Figure 2 User interface for a chart customizer -
Fill in the properties as prompted by the user interface. For example, the following values for Legend Shape change the legend to a circle:
-
Apply to: All Items
- Shape Type: Ellipse
- Width: 10
- Height: 10
-
Click Finish.
The customizer selection dialog is closed and the customizer is applied to your chart. Click Preview to view your chart.
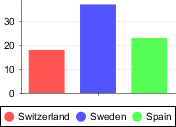 |
| Figure 3 Result of chart customizer |
Adding a Customizer to a Chart in Earlier Versions of Jaspersoft Studio
You can add a customizer to a chart in an earlier version of Jaspersoft Studio using advanced properties. You cannot add more than one customizer and the customizer cannot be configurable. For more information about creating a customizer jar, see 1.1.3, “Creating a Chart Customizer,” on page 1:
-
Add the customizer jar to your classpath.
-
Select the chart in Design view.
-
In the Advanced tab of the Properties view, click … next to Common Chart Properties >Customizer Class.
The Open Type dialog is displayed.
-
Enter the name of your class in the Open Type dialog and click OK.
Creating a Chart Customizer
To create a chart customizer, you must extend or implement JRAbstractChartCustomizer, which defines a customize method that takes a JFreeChart object and a JasperReports chart object as parameters. The customize method lets you access the settings for a chart. You can also create configurable chart customizers.
JasperReports Library provides customizer classes that extend JRAbstractChartCustomizer, which you can use for your chart customizers. To see the available customizer classes, see the Javadoc for the JasperReports Library API. You can also download the JasperReports Library source and look at the samples in the demo/samples/chartcustomizer directory.
Jaspersoft Studio uses a JSON descriptor format to register certain components and optionally create a UI for the component. This framework is used for JFreeChart customizers as well as being used internally.
Example of Creating a Customizer Class
The following example shows a customizer, RangeAxisCustomizerSample, and a JSON file for the user interface. This example allows the user to set the maximum and minimum values on the X and Y axis and to set the interval for the ticks on the Y axis.
To use this customizer in a report:
- Create and compile the customizer and add the jar to your classpath. For information about compiling your files with Jaspersoft Studio and Eclipse, see Working with Java in Eclipse.
- Create a JSON file that references your customizer and defines its UI.
- Add the JSON file to the Jaspersoft Studio user interface.
To create the example customizer class
A customizer class takes two arguments, a JFreeChart and a JasperReports Chart object. The RangeAxisCustomizerSample customizer extends the AbstractAxisCustomizer class, which is an extension of JRAbstractChartCustomizer for working with axis properties. AbstractAxisCustomizer exposes three constants for a chart axis: the minimum and maximum values on the Y axis and the spacing of the ticks on the Y-axis display:
Constants in the AbstractAxisCustomizer class
|
A chart customizer defines a customize method that takes a JFreeChart object and a JRChart object. The customize method can access chart settings and change them. During report execution, JasperReports calls the customize method for the chart and applies the settings, along with the settings from the JSON file. RangeAxisCustomizerSample is as shown below.
RangeAxisCustomizerSample
|
Example of a JSON file for the user interface
The following JSON file lets the user enter values for the configurable properties in RangeAxisCustomizerSample. The JSON file uses the generic framework for the Jaspersoft Studio user interface.
|
A JSON file for a chart customizer has the following members:
-
label: Name for the customizer in the chart customizer selection dialog. -
description: Text that appears on hover. -
customizerClass: Full class name of your customizer. -
supportedPlot: Array of chart types supported by the customizer. Chart types are designated by a numeric code, shown in the following table.Chart Codes for supportedPlot in JSON Files
Chart Type Code in JasperReports CHART_TYPE_AREA 1 CHART_TYPE_BAR3D 2 CHART_TYPE_BAR 3 CHART_TYPE_BUBBLE 4 CHART_TYPE_CANDLESTICK 5 CHART_TYPE_HIGHLOW 6 CHART_TYPE_LINE 7 CHART_TYPE_PIE3D 8 CHART_TYPE_PIE 9 CHART_TYPE_SCATTER 10 CHART_TYPE_STACKEDBAR3D 11 CHART_TYPE_STACKEDBAR 12 CHART_TYPE_XYAREA 13 CHART_TYPE_XYBAR 14 CHART_TYPE_XYLINE 15 CHART_TYPE_TIMESERIES 16 CHART_TYPE_METER 17 CHART_TYPE_THERMOMETER 18 CHART_TYPE_MULTI_AXIS 19 CHART_TYPE_STACKEDAREA 20 CHART_TYPE_GANTT 21 -
sections: Property that controls the display of the user interface. Has the following attributes:-
name: Name for the user interface dialog. -
expandable: Boolean; for chart customizers, always set tofalse. -
properties: Attribute that contains sections to define each entry box in the user interface. Each entry box has the following attributes:name: Name of the argument to pass to the customizer class.label: Name that appears in the user interface.description: Tooltip that appears on hover.mandatory: Boolean. When true, the property is required. When false, the property is optional.readOnly: Sets attribute as read-only. Not used for chart customizers.type: Type of the attribute, as expected by the customizer class.defaultValue(optional): Default value for an optional property.
-
Note
To add a non-configurable customizer, use an empty list for the properties. For example:
To add a JSON UI definition file to the Report Designer
- Select Window > Preferences (Eclipse > Preferences on Mac).
- In the Preferences dialog, select Jaspersoft Studio > Report Designer > Chart Customizers.
- Click Add.
- In the Select Destination dialog, browse to the location of your JSON file.
- Click OK.
- Click OK again to close the Preferences dialog.